Module 1 Why Statistics is Important
1.1 Introductory Example
The city of Ashland performed an investigation in the area of Kreher Park (Figure 1.1) when considering the possible expansion of an existing wastewater treatment facility in 1989. The discovery of contamination from creosote waste in the subsoils and ground water at Kreher Park prompted the city to abandon the project. A subsequent assessment by the Wisconsin Department of Natural Resources (WDNR) indicated elevated levels of hazardous substances in soil borings, ground water samples, and in the sediments of Chequamegon Bay directly offshore of Kreher Park. In 1995 and 1999, the Northern States Power Company conducted investigations that further defined the area of contamination and confirmed the presence of specific contaminants associated with coal tar wastes. This site was then listed as a superfund site and was given considerably more attention.1
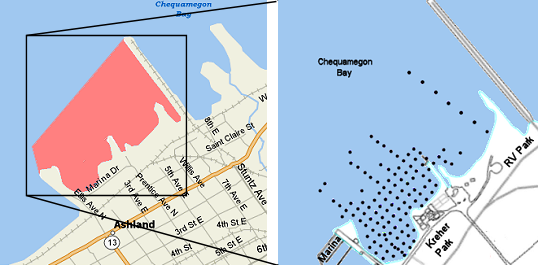
Figure 1.1: Location of the Ashland superfund site (left) with the location of 119 historical sediment sampling sites (right).
The WDNR wants to study elements in the sediment (among other things) in the entire 3000 m2 area shaded in Figure 1.1. Is it physically possible to examine every square meter of that area? Is it prudent, ecologically and economically, to examine every square meter of this area? The answer, of course, is “no.” How then will the WDNR be able to make conclusions about this entire area if they cannot reasonably examine the whole area? The most reasonable solution is to sample a subset of the area and use the results from this sample to make inferences about the entire area.
Methods for properly selecting a sample that fairly represents a larger collection of individuals are an important area of study in statistics. For example, the WDNR would not want to sample areas that are only conveniently near shore because this will likely not be an accurate representation of the entire area. In this example, it appears that the WDNR used a grid to assure a relatively even dispersal of samples throughout the study area (Figure 1.1). Methods for choosing the number of individuals to select and how to select those individuals are discussed in Module 3.
Suppose that the WDNR measured the concentration of lead at each of the 119 locations shown in Figure 1.1. Further suppose that they presented their results at a public meeting by simply showing the list of lead concentration measurements (Table 1.1). Is it easy to make conclusions about what these data mean from this type of presentation?
| 0.91 | 1.09 | 1.00 | 1.09 | 1.06 | 0.98 | 0.98 | 0.94 | 0.89 | 1.09 | 0.91 | 1.06 | 0.81 | 0.90 | 1.21 |
| 1.03 | 0.95 | 1.14 | 0.99 | 0.99 | 0.96 | 1.13 | 0.84 | 1.03 | 0.86 | 0.98 | 1.04 | 0.91 | 1.27 | 0.90 |
| 0.87 | 1.23 | 1.12 | 0.98 | 0.79 | 1.10 | 1.06 | 1.09 | 0.73 | 0.81 | 1.18 | 0.92 | 0.82 | 1.11 | 0.97 |
| 1.24 | 1.06 | 1.09 | 0.78 | 0.94 | 1.08 | 0.91 | 0.98 | 1.22 | 1.04 | 0.77 | 1.18 | 0.93 | 1.14 | 0.94 |
| 1.05 | 0.91 | 1.14 | 0.93 | 0.94 | 0.90 | 1.05 | 1.36 | 1.02 | 0.93 | 1.09 | 1.17 | 0.91 | 1.06 | 0.95 |
| 0.88 | 0.67 | 1.12 | 1.06 | 0.99 | 0.89 | 0.83 | 0.99 | 1.33 | 1.00 | 1.05 | 1.11 | 1.01 | 1.25 | 0.96 |
| 1.07 | 1.17 | 1.01 | 1.20 | 1.17 | 1.05 | 1.21 | 1.10 | 1.07 | 1.01 | 1.16 | 1.24 | 0.86 | 0.90 | 1.07 |
| 1.11 | 0.99 | 0.70 | 0.98 | 1.11 | 1.12 | 1.30 | 1.00 | 0.89 | 0.91 | 0.95 | 1.08 | 1.02 | 0.93 |
Instead, suppose that the scientists brought a simple plot of the frequency of observed lead concentrations and brief numerical summaries (Figure 1.2) to the meeting. With these one can easily see that the measurements were fairly symmetric with no obviously “weird” values. The lead concentrations ranged from as low as 0.67 \(\mu g \cdot m^{-3}\) to as high as 1.36 \(\mu g \cdot m^{-3}\) with the measurements centered on approximately 1.0 \(\mu g \cdot m^{-3}\). These summaries are discussed in detail in Module 4. However, at this point, note that summarizing large quantities of data with few graphical or numerical summaries makes it is easier to identify meaning from data.
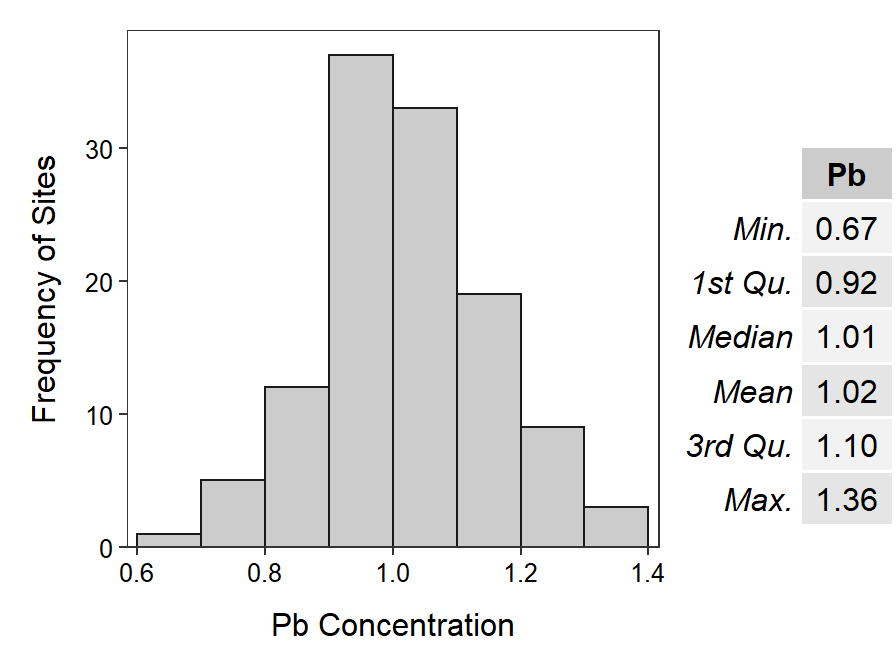
Figure 1.2: Histogram and summary statistics of lead concentration measurements (\(\mu g \cdot m^{-3}\)) at each of 119 sites in Kreher Park superfund site.
A critical question at this point is whether or not the results from the one sample of 119 sites perfectly represents the results for the entire area. One way to consider this question is to examine the results obtained from another sample of 119 sites. The results from this second sample (Figure 1.3) are clearly, though not radically, different from the results of the first sample. Thus, it is seen that any one sample from a larger whole will not perfectly represent the large whole. This will lead to some uncertainty in our summaries of the larger whole.
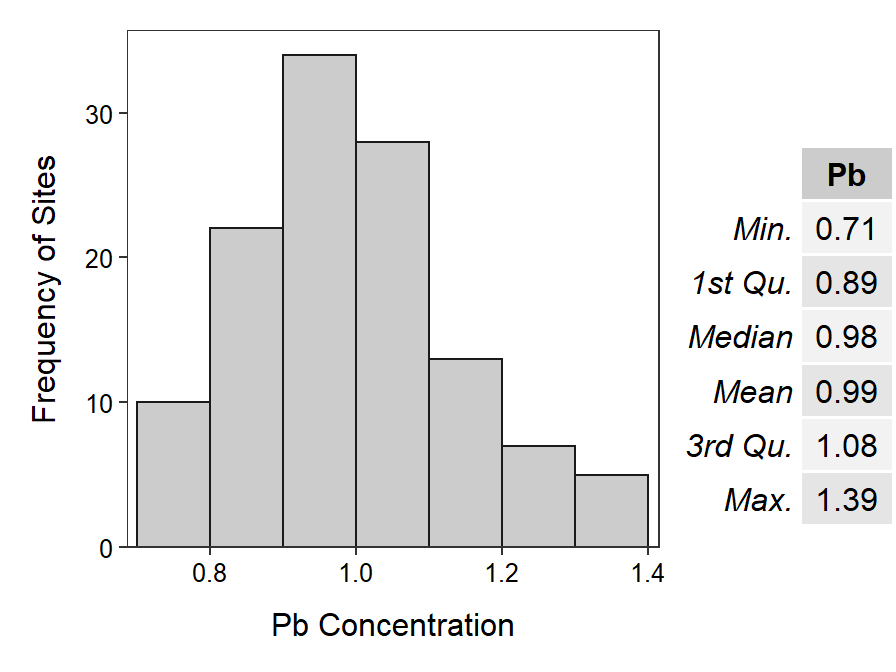
Figure 1.3: Histogram and summary statistics of lead concentration measurements (\(\mu g \cdot m^{-3}\)) at each of 119 sites (different from the sites shown in Figure 1.2) in Kreher Park superfund site.
The results from two different samples do not perfectly agree because each sample contains different individuals (sites in this example), and no two individuals are exactly alike. The fact that no two individuals are exactly alike is natural variability, because of the “natural” differences that occur among individuals. The fact that the results from different samples (from the same populatino) are different is called sampling variability. If there was no natural variability, then there would be no sampling variability. If there was no sampling variability, then the field of statistics would not be needed because a sample (even of one individual) would perfectly represent the larger group of individuals. Thus, understanding variability is at the core of statistical practice. Natural and sampling variability will be revisited continuously throughout this course.
This may be unsettling! First, it was shown that an entire area or all of the individuals of interest cannot be examined. It was then shown that a sample of individuals from the larger whole did not perfectly represent the larger whole. Furthermore, each sample is unique and will likely lead to a (slightly) different conclusion. These are all real and difficult issues faced by the practicing scientist and considered by the informed consumer. However, the field of statistics is designed to “deal with” these issues such that the results from a relatively small subset of measurements can be used to make conclusions about the entire collection of measurements.
1.2 Major Goals of Statistics
As seen in the Kreher Park example, the field of statistics has two primary purposes. First, statistics provides methods to summarize large quantities of data into concise and informative numerical or graphical summaries. For example, it was easier to discern the general underlying structure of the lead measurements from the statistics and histograms presented in Figures 1.2 and 1.3, than it was from the full list of lead measurements in Table 1.1. Second, statistical methods allow inferences to be made about all individuals (i.e., a population) from a few individuals (i.e., a sample).3
1.3 Why Does Statistics (as a tool) Exist?
Besides demonstrating the two major goals of statistics, the Kreher Park example illustrates three “realities” that exist in nature and life that necessitate the need for statistics as tool for understanding. First, in most realistic situations it is not possible or, at least, not reasonable to “see” the entire population. For example, it was not reasonable to sample the sediments throughout the entire contaminated area near Kreher Park. In other examples, is it possible (or reasonable) to examine every Northern Short-Tailed Shew (Blarina bevicauda) in Great Lakes states, every person of legal voting age in Wisconsin, or every click on Facebook? Second, as described above, variability exists, both among individuals and results of samples. Third, because we must take samples from populations and those samples are both imperfect representations of the population and sampling variability exists, our conclusions about the population are uncertain. For example, the first sample in the Kreher Park example suggested that the mean lead concentration was 1.02 \(\mu g \cdot m^{-3}\), whereas the second sample was 0.98 \(\mu g \cdot m^{-3}\). You have also seen this concept when the margin-of-error in poll results are presented. In summary, statistics exist because we must sample instead of observe entire populations, variability is ever present, and the conclusions from samples are uncertain.
1.4 Definition of Statistics
Statistics is the science of collecting, organizing, and interpreting numerical information or data (Moore and McCabe 1998). People study statistics for a variety of reasons, including (Bluman 2000):
- To understand the statistical studies performed in their field (i.e., be knowledgeable about the vocabulary, symbols, concepts, and statistical procedures used in those studies).
- To conduct research in their field (i.e., be able to design experiments and samples; collect, organize, analyze, and summarize data; make reliable predictions or forecasts for future use; and communicate statistical results).
- To be better consumers of statistical information.
Statistics permeates a wide variety of disciplines. Moore and McCabe (1998) state:
The study and collection of data are important in the work of many professions, so that training in the science of statistics is valuable preparation for a variety of careers. Each month, for example, government statistical offices release the latest numerical information on unemployment and inflation. Economists and financial advisers, as well as policy makers in government and business study these data in order to make informed decisions. Doctors must understand the origin and trustworthiness of the data that appear in medical journals if they are to offer their patients the most effective treatments. Politicians rely on data from polls of public opinion. Business decisions are based on market research data that reveal customer tastes. Farmers study data from field trials of new crop varieties. Engineers gather data on the quality and reliability of manufactured products. Most areas of academic study make use of numbers, and therefore also make use of the methods of statistics.