Module 1 Model Types & Methods
During this course we will examine a variety of models called either general linear or generalIZED linear models. General linear models have a quantitative response variable and generally assume that the “errors” around the model follow a normal distribution. General linear models that we will discuss are One-Way ANOVA1, Two-WAY ANOVA, Simple Linear Regression, and Indicator Variable Regression. GeneralIZED linear models do not require a quantitative response variable nor “errors” that are normally distributed. Thus, generalIZED linear models are more flexible than general linear models. The only generalIZED linear model that we will encounter in this course is Logistic Regression, but the chi-square test from your introductory statistics course can also be cast as a generalIZED linear model.
Response Variable: The variable thought to depend upon, be explained by, or be predicted by other variables.
All models covered in this course will have only one response variable
Both general and generalIZED linear models can have a single explanatory variable that can be either quantitative or categorical, or multiple explanatory variables that can be all quantitative, all categorical, or a mixture of both quantitative and categorical. Ultimately, there can be several explanatory variables in a model, but we will only consider one or two explanatory variables in this course.
Explanatory Variable: A variable thought to explain or be able to predict the response variable.
1.1 Distinguishing Methods
The five methods covered in this course can be distinguished by considering only the type of response variable and the types and number of explanatory variables (Table 1.1). Thus, you should review variable types and definitions and distinctions of response and explanatory variables from your introductory statistics course.
| Linear Model | Response | Explanatory |
|---|---|---|
| One-Way ANOVA | Quantitative | Categorical (only one) |
| Two-Way ANOVA | Quantitative | Categorical (two) |
| Simple Linear Regression (SLR) | Quantitative | Quantitative (only one) |
| Indicator Variable Regression (IVR) | Quantitative | Quantitative (one) & Categorical (one) |
| (Binary) Logistic Regression | Binomial | Quantitative (or Both) |
1.2 Method Purposes
As seen above, each method uses different types of data. Not surprisingly then, each method tests different hypotheses or has a different analytical purpose. These purposes will be discussed in detail in subsequent modules. However, the major objective of each method is explained briefly below (in the order that we will cover them).
Each example uses a data set that contains data about mirex concentrations (mirex) for two species of salmon (species) captured in six years between 1977 and 1999 (year) in Lake Ontario. The weight of each fish (weight) and whether or not the mirex concentration exceeded the EPA limit of 0.1 mg/kg (exceeds_limit) were also recorded.
A one-way ANOVA is used to determine if the means of the quantitative response variable (mirex) differ among two or more groups defined by a single categorical variable (e.g., year).
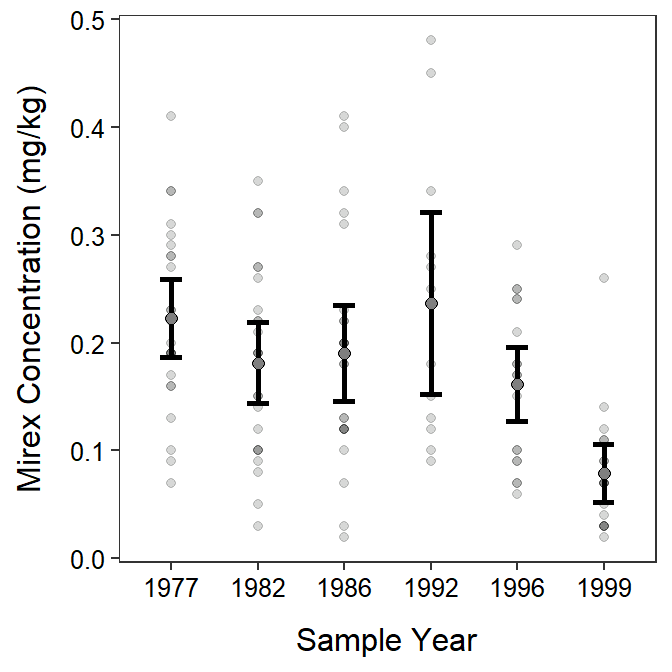
Figure 1.1: Mean mirex concentration by sample year. This is an example of a One-Way ANOVA.
A two-way ANOVA is used to determine if the means of the quantitative response variable (mirex) differ among groups of one categorical variable (e.g., year), among groups of another categorical variable (e.g., species), or by the interaction between the two categorical variables.
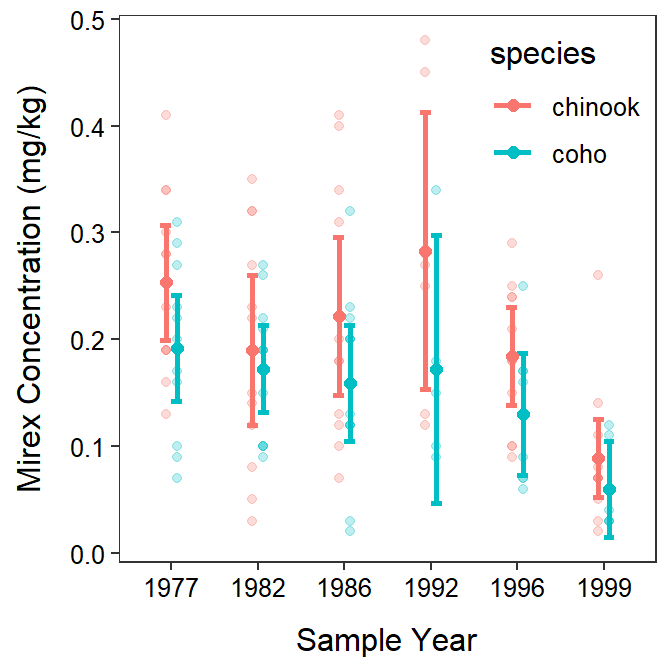
Figure 1.2: Mean mirex concentration by sample year and salmon species. This is an example of a Two-Way ANOVA.
A simple linear regression is used to determine if there is a relationship between the quantitative response variable (e.g., mirex) and a single quantitative explanatory variable (e.g., weight).
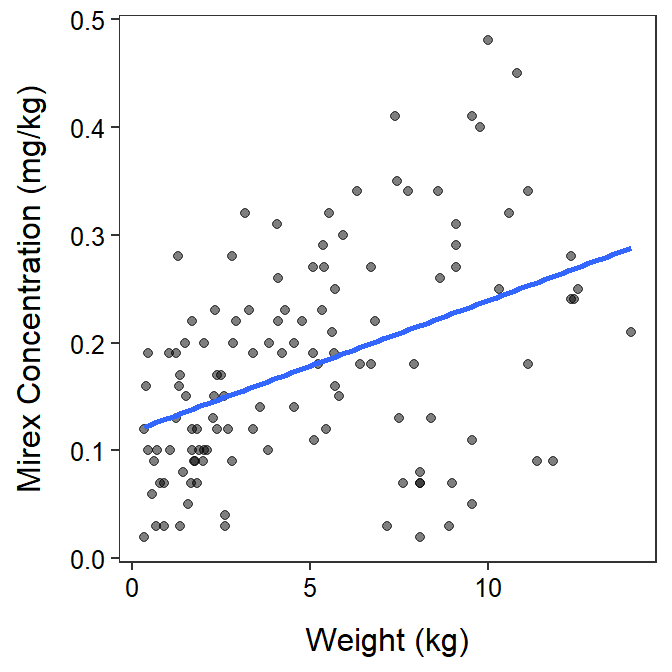
Figure 1.3: Mirex concentration by fish weight. This is an example of a Simple Linear Regression.
An indicator variable regression is used to determine if the relationship between a quantitative response (e.g., mirex) and a quantitative explanatory variable (e.g., weight) differs between two or more groups defined by a categorical explanatory variable (e.g., species). This will look like two (or more) simple linear regressions are being compared.
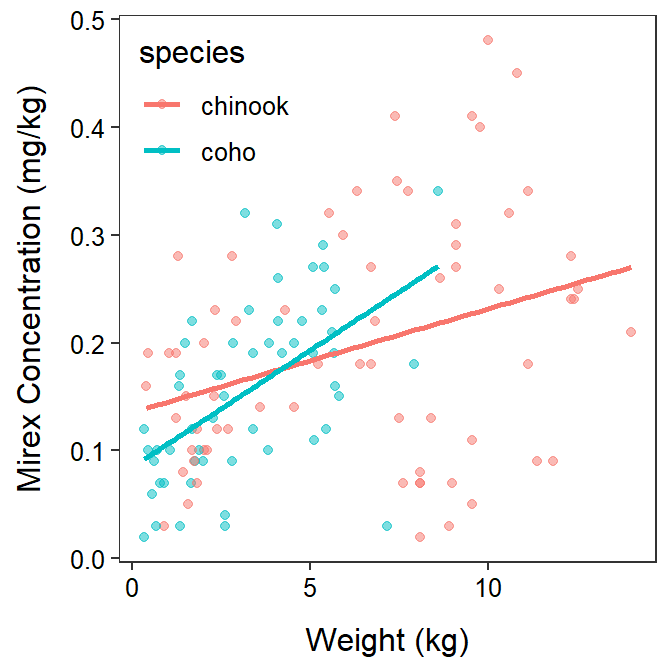
Figure 1.4: Mirex concentration by fish weight seprated by salmon species. This is an example of an Indicator Variable Regression.
A logistic regression is used to determine if there is a relationship between the probability of “success” for a binary2 categorical response variable (e.g., exceeds_limit) and the quantitative explanatory variable (e.g., weight).
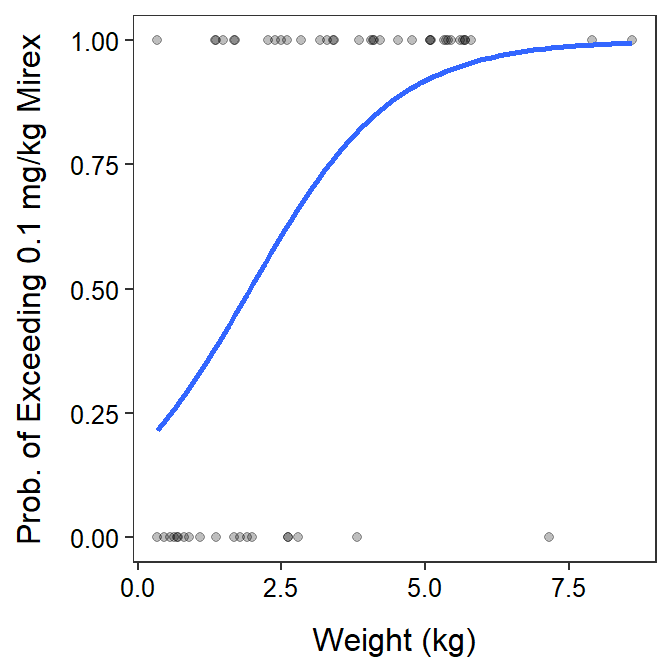
Figure 1.5: The probability that the mirex concentration exceeded the 0.1 mg/kg threshold by fish weight. This is an example of a Logistic Regression.
From these examples it should be apparent that “ANOVAs” compare means among groups and will look like means (usually with confidence intervals) plotted as points for each group. In contrast “regressions” explore relationships and will look like a line or a curve when plotted.
ANOVAs compare means; regressions examine relationships.