Note: Your answers to the questions below should follow the expectations for homework found here. Questions outside of class can be asked on the Module Assignments-Questions Teams channel (see link on homepage).
Type of Variables?
- Temperature (oC)
- Habitat complexity (low, medium, high)
- Stock price
- Brood size (i.e., number of young)
- Forest type (deciduous, mixed, coniferous)
- Number of docks (on a lake shoreline)
- Continent (North American, South America, etc.)
- Survived (yes, no)
- Age (years)
- Race (White, Black, Native American, etc.)
What is the Response Variable?
- Can length be used to predict weight?
- How is estimated temperature affected by estimated carbon dioxide in the EPICA Dome C ice core in Antarctica?
- Does metabolic rate differ by sex of rabbit?
- Is there a relationship between how much money a person makes and their satisfaction with deer harvest regulations?
- Is there a relationship between how much money a person makes and how much they weigh?
Type of Model
For each question below decide which type of analysis (e.g., one-way ANOVA, two-way ANOVA, simple linear regression, indicator variable regression, or logistic regression) should be used and why. Your answer to "why" should include identifying the response variable, the explanatory variable(s), and the type and number of each variable. [Hint: Use Table 1.1 from the reading.]
- A student explored the relationship between the number of calories and number of carbohydrates (in g) for each item on a Starbucks menu.1
- Researchers wanted to determine if the mean batting average (the proportion of hits per attempts) differed among positions (outfield, infield, and designated hitter) for major leagues baseball players.1
- A director of education wanted to use a students’ grade-point-average in classes related to the subject matter of a certifying exam to predict whether or not a student would pass that exam on the first attempt.
- Researchers studying anthropometry collected body girth measurements and skeletal diameter measurements, as well as age, weight, height, and sex for 507 physically active individuals. In one aspect of their research, they wanted to determine if the relationship between body weight and hip girth differed by sex (i.e., between males and females).1
- Researchers wanted to determine if the body temperature of snails was affected by the color (light, intermediate, or dark) of the intertidal rock which the snail inhabited and whether the snail was found individually, in a small group (2-5 individuals), or a large group (>5 individuals).
- An experiment was created to compare the effectiveness of various feed supplements on the growth rate of chickens. Newly hatched chicks were randomly allocated into six groups and each group was given a different feed supplement. The chicks’ weights (in grams) after six weeks was recorded. Interest was in determining if mean chick weight differed among the six feed types.1
- The 2018 Environmental Performance Index (EPI) ranks 180 countries on 24 performance indicators covering environmental health and ecosystem vitality. These numeric metrics provide a gauge for how close countries are to established environmental policy goals and, thus, offers a scorecard that highlights leaders in environmental performance and provides guidance for countries that aspire to be leaders in sustainability. One goal with these data was to examine the relationship between an environmental health index (a numeric related to air quality, water quality, and lead exposure) and the overall EPI for 180 nations.
- Researchers questioned whether morphological changes would occur in rodents held in captivity and whether those changes might differ by speices. To examine this question they measured the liver weight (among other things) of House Mouses (Mus musculus) and Deer Mouses (Peromyscus maniculatus) captured in the wild or raised in captivity.
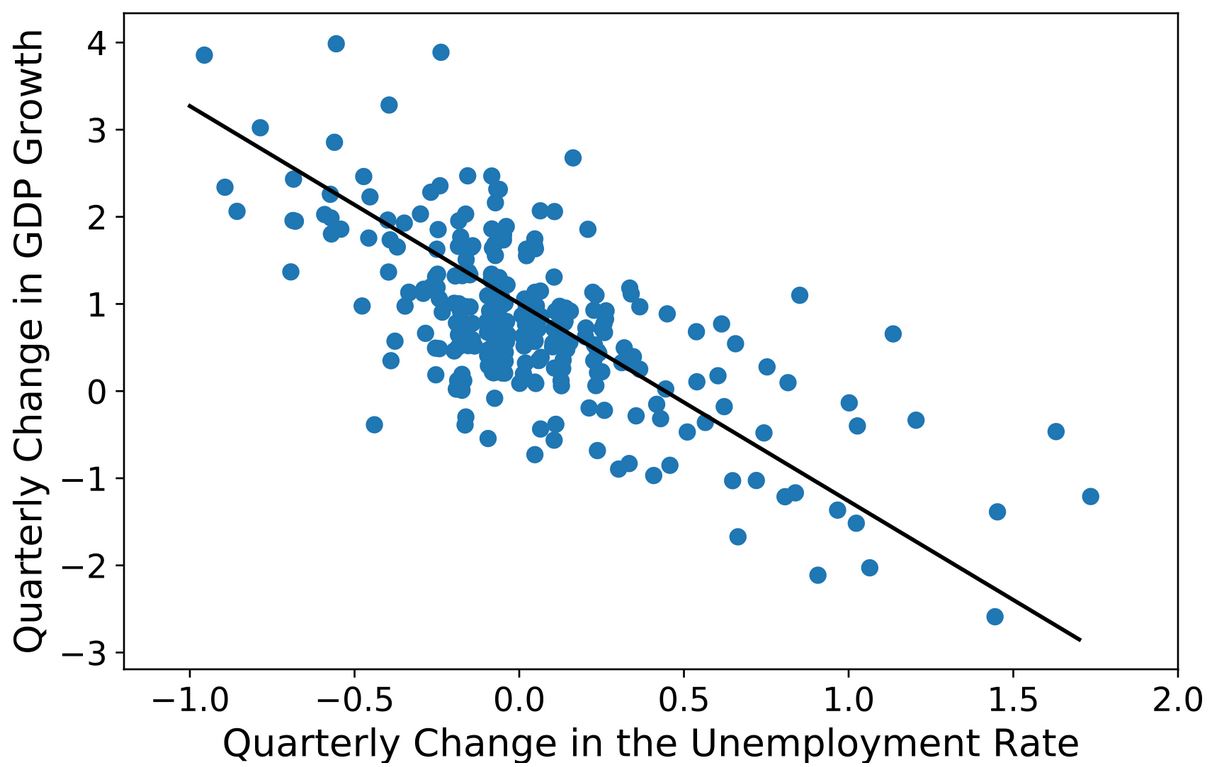
- Okun’s Law in Macroeconomics

Footnotes
1 This example is essentially from the Open Intro Statistics book. ↩