Note: Your answers to the questions below should follow the expectations for homework found here. Questions outside of class can be asked on the Module Assignments-Questions Teams channel (see link on homepage).
Design of a Two-Factor Experiment
A chemical engineer is designing the production process for a new product. The chemical reaction that produces the product may have higher or lower yield, depending on the temperature and stirring rate in the vessel in which the reaction takes place. The engineer decides to investigate the effect on yield of three temperatures (50oC, 55oC, and 60oC) and three stirring rates (60, 90, and 120 rpm). A new vessel should be used for each production and only 36 vessels exist. Help the engineer set up this experiment by answering the questions below.
- What is the response variable?
- What are the factors (list all of them)?
- How many levels are there (list in same order as you listed factors)?
- How many treatments are there?
- How many replicates are there?
- Physically, what is a replicate (i.e., not a number)?
- Identify the individuals that will receive each treatment. Show your R work.1
Means Table and Interaction Plot
The table below represents the group or treatment means created from two factors. Use this information to answer the questions below.
| A | B | C | D | |
|---|---|---|---|---|
| W | 50 | 50 | 35 | 40 |
| Z | 40 | 45 | 30 | 45 |
- Hand draw an interaction plot with the factor that has levels A-D on the x-axis.
- Hand draw an interaction plot with the factor that has levels W and Z on the x-axis.
Interaction and Main Effects
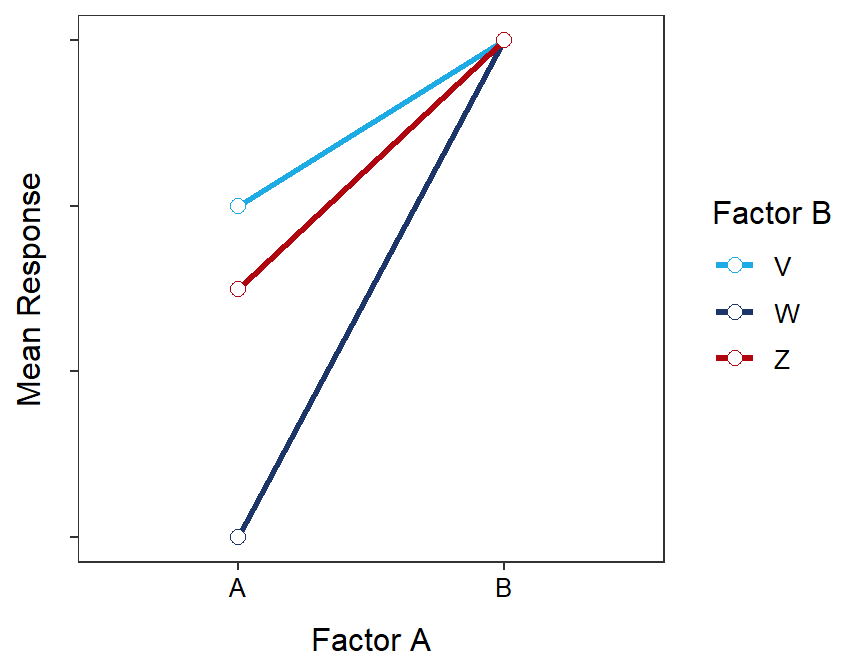
For each interaction plot below determine which effects (interaction, factor A main, or factor B main) are illustrated. Provide a short explanation for each of your answers (i.e., how did you come to your conclusions).
- Figure 1. ↴
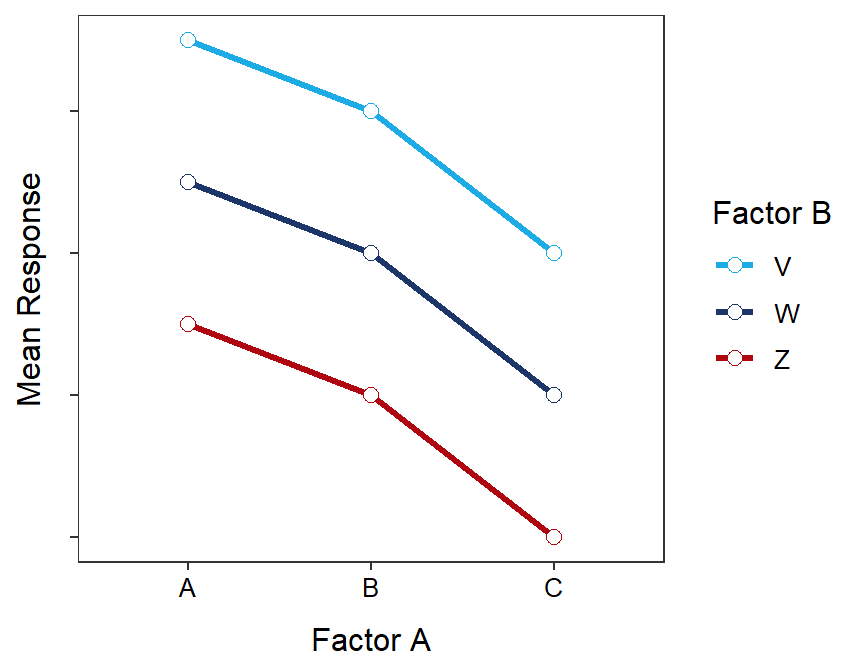
- Figure 2. ↴
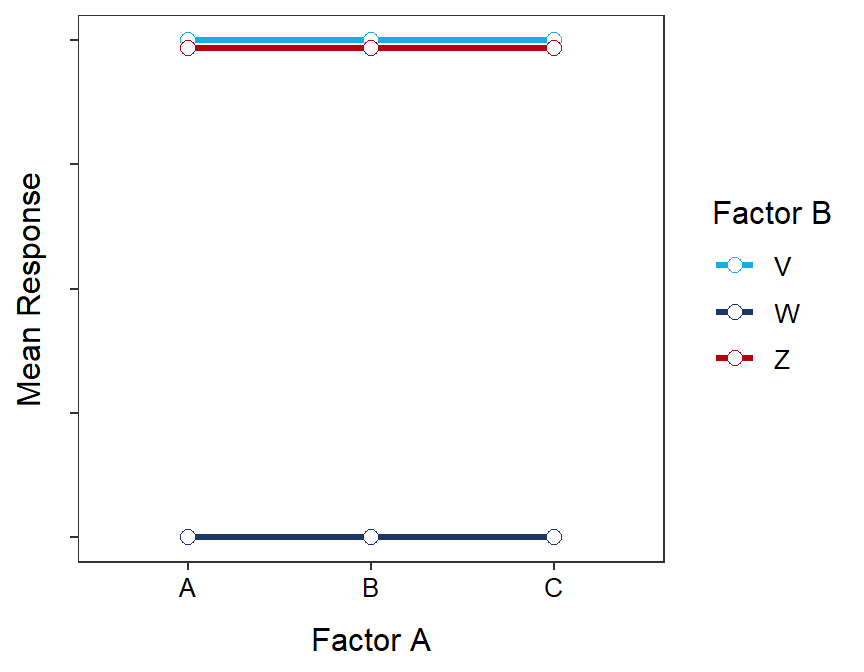
- Figure 3. ↴
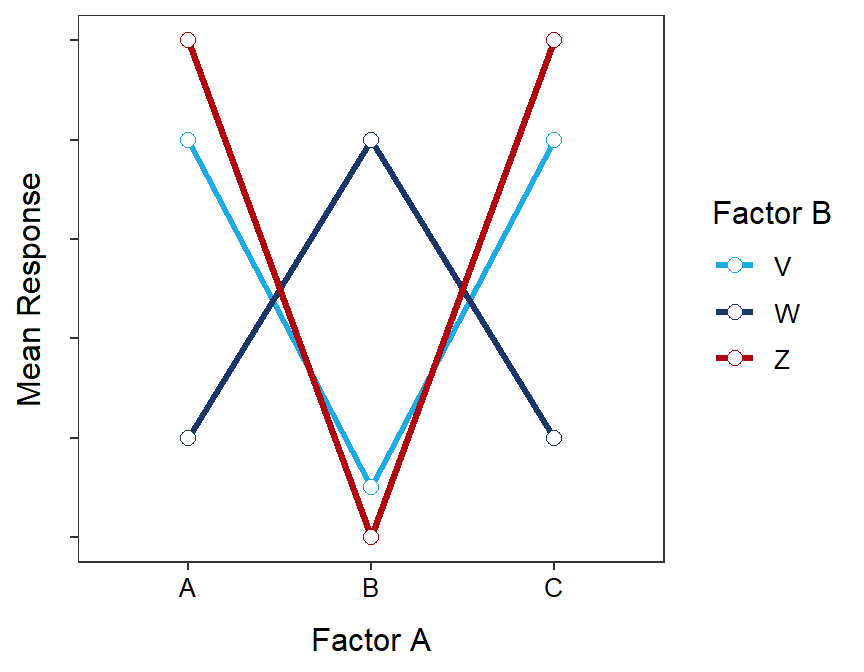
- Figure 4. ↴
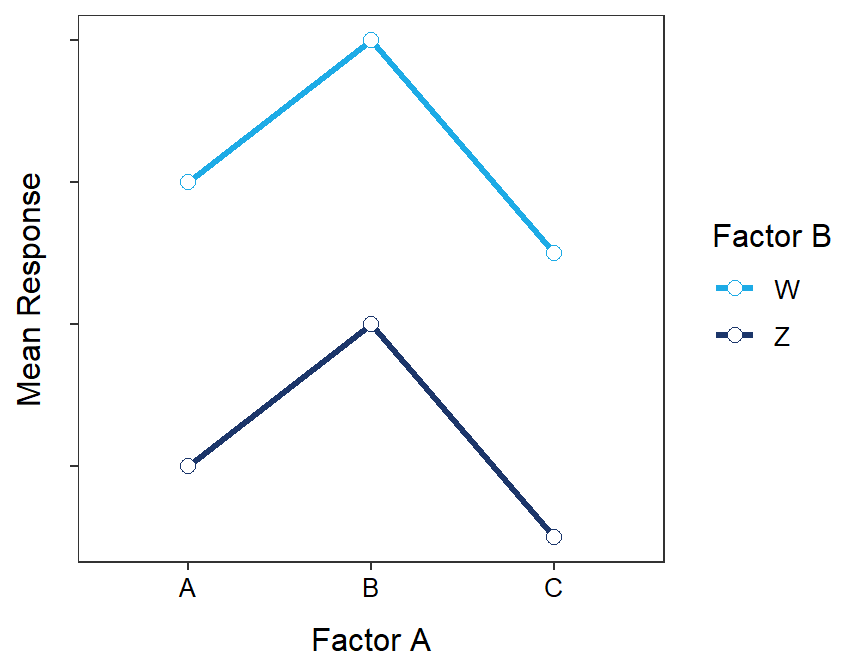
- Figure 5. ↴
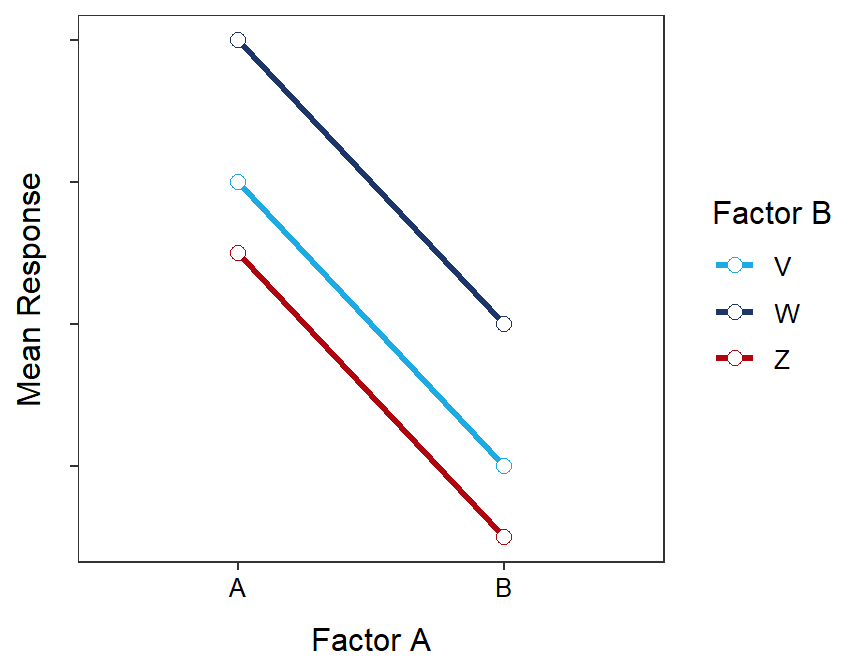
- Figure 6. ↴
Means Tables
Below are three means tables that each corresponds to one of the figures in the previous questions. For each table, identify which figure above that it corresponds to.
- Table 1. ↴
| V | W | Z | |
|---|---|---|---|
| A | 2.5 | 3 | 2.25 |
| B | 1.5 | 2 | 1.25 |
- Table 2. ↴
| V | W | Z | |
|---|---|---|---|
| A | 3.5 | 1.5 | 3.47 |
| B | 3.5 | 1.5 | 3.47 |
| C | 3.5 | 1.5 | 3.47 |
- Table 3. ↴
| V | W | Z | |
|---|---|---|---|
| A | 2.5 | 1.5 | 2.25 |
| B | 3.0 | 3.0 | 3.00 |
Note that
sample(n)wherenis replaced with a number will randomly “jumble” n numbers.↩︎