Personal Gas Purchases I
I have recorded data for every tank of gas that I have put into the truck that I bought in 2018. In the figure and table below I summarize the miles-per-gallon for each tank of gas. Use these results to perform a univariate EDA.
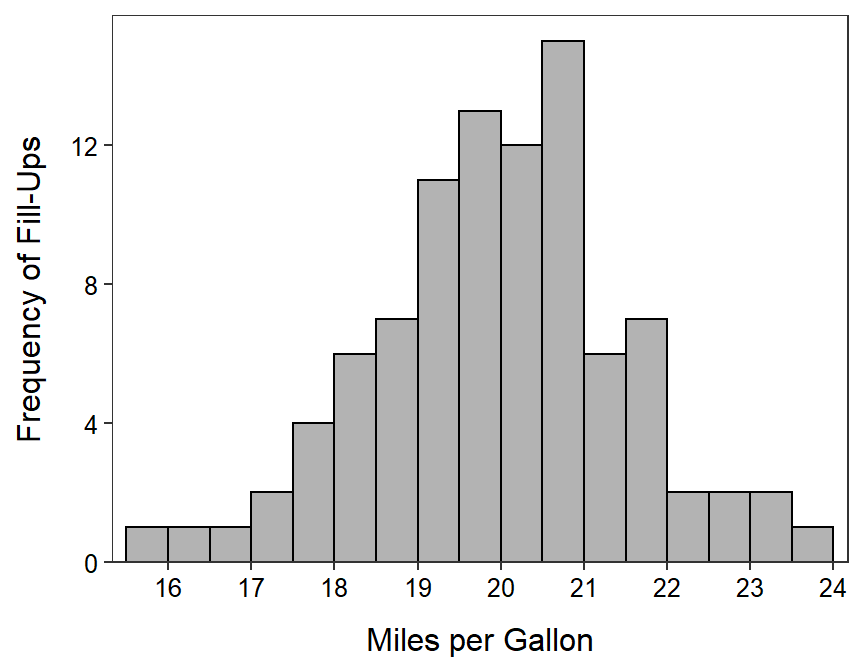
     n   mean     sd    min     Q1 median     Q3    max
130.00  19.35   2.09  12.69  18.33  19.73  20.76  23.68
Personal Gas Purchases II
The graph and table below show the price per gallon each time I filled the tank. Use the results to perform a univariate EDA.
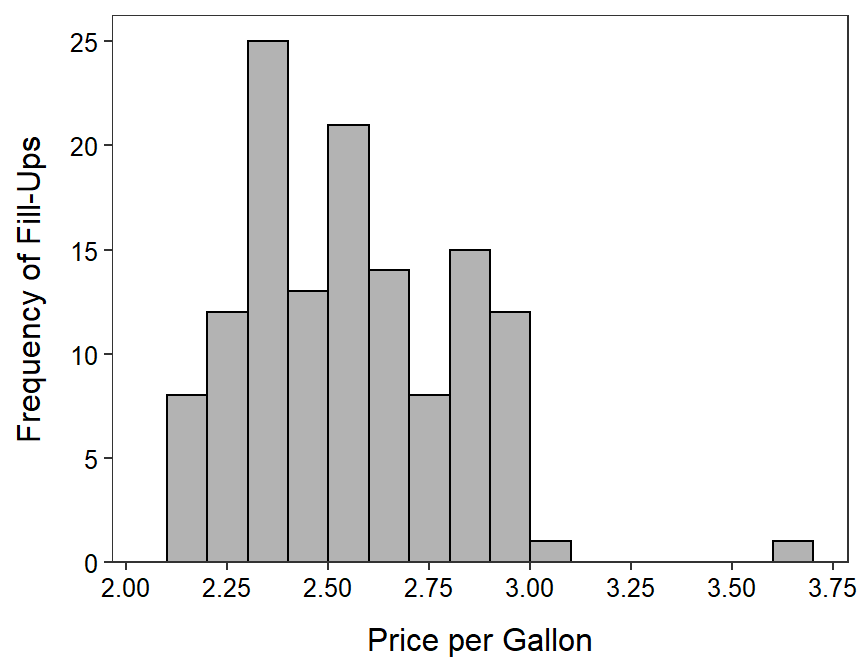
      n    mean      sd     min      Q1  median      Q3     max
130.000   2.569   0.263   2.109   2.349   2.539   2.799   3.609
Personal Gas Purchases III
Finally, the graph below shows the frequency and the table below shows the percentage of towns in which I bought each tank of gas. Use these results to perform a univariate EDA.
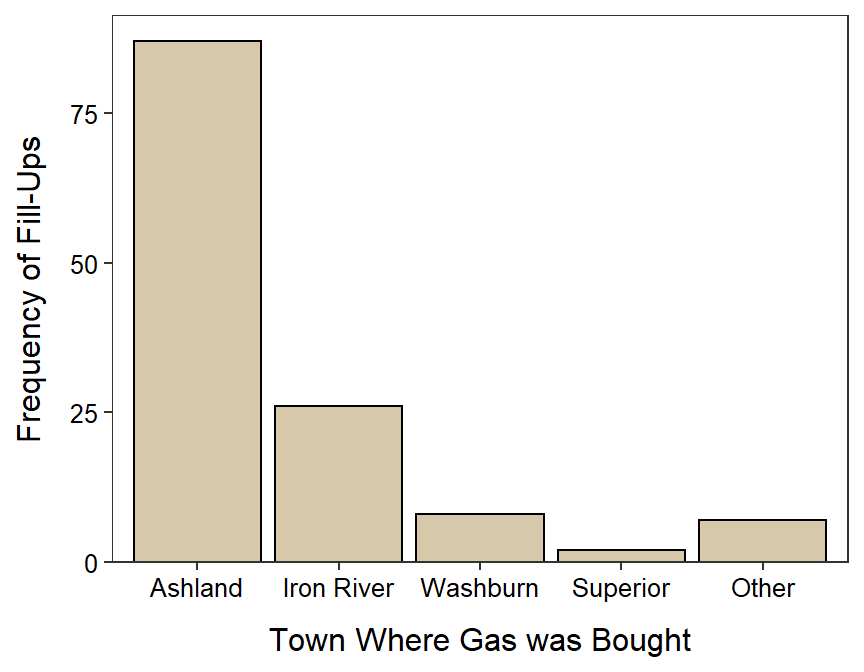
town2
   Ashland Iron River   Washburn   Superior      Other
      66.9       20.0        6.2        1.5        5.4