- Quantitative
- Categorical
Quantitative
Time Spent Playing Video Games
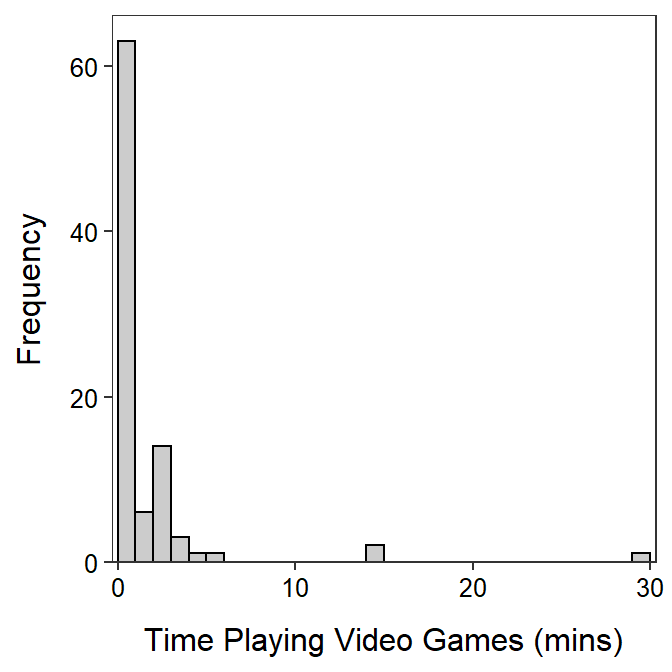
For a class project, a student asked 91 students how much time they had spent playing video games in the last two days. Use the results in Figure 1 and Table 1 to construct a univariate EDA for these data.

Figure 1: Histogram for the time playing video games (mins) by sampled students.
Table 1: Summary statistics for the time playing video games (mins) by sampled students.
       n     mean       sd      min       Q1   median       Q3      max percZero
   91.00     1.24     3.78     0.00     0.00     0.00     1.25    30.00    62.64
Bank Transaction Times
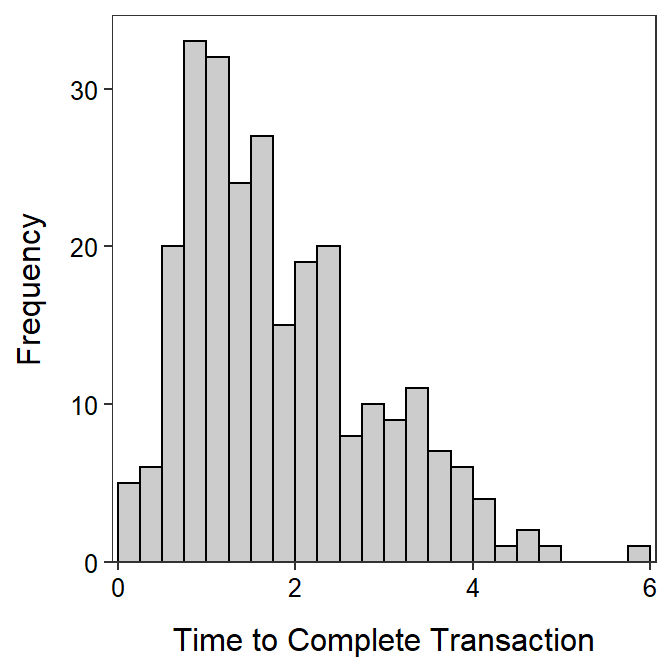
Cunningham and Heathcote (1989) recorded the total transaction time (in hours) for a large number of transactions at a branch office of a large Australian bank. Describe the distribution of these data from Figure 2 and Table 2.

Figure 2: Histogram for the time (hrs) to complete a transactin for an Australian bank.
Table 2: Summary statistics for the time (hrs) to complete a transactin for an Australian bank.
     n   mean     sd    min     Q1 median     Q3    max
261.00   1.84   1.05   0.14   1.00   1.55   2.42   5.76
Categorical
Drinking Water Source
The Environmental Protection Agency (EPA) commissioned the Gallup Organization to conduct a nationwide telephone survey of 1000 households during August and September of 2002 regarding consumer knowledge and satisfaction with drinking water quality. Of the 1000 respondents surveyed, 751 knew that their drinking water came from a public or commercial water supplier. Of these 751 respondents, the following percentages knew precisely where that water was derived:
| Source | Groundwater | Lake/ Reservoir | River | Multiple Sources | Don’t Know | Refused to answer |
|---|---|---|---|---|---|---|
| Percentage | 15.9 | 29.2 | 9.6 | 15.7 | 29.4 | 0.2 |
- Construct a frequency table of these data (note percentages above were rounded).
- Write a brief conclusion derived from these data.