- General Understanding
General Understanding
Normal Distribution Characteristics II
For each situation below, (i) identify μ, (ii) identify σ, and (iii) draw the normal distribution with an approximately accurate scale on the x-axis. 1. Z~N(0,1) 1. Y~N(90,8)
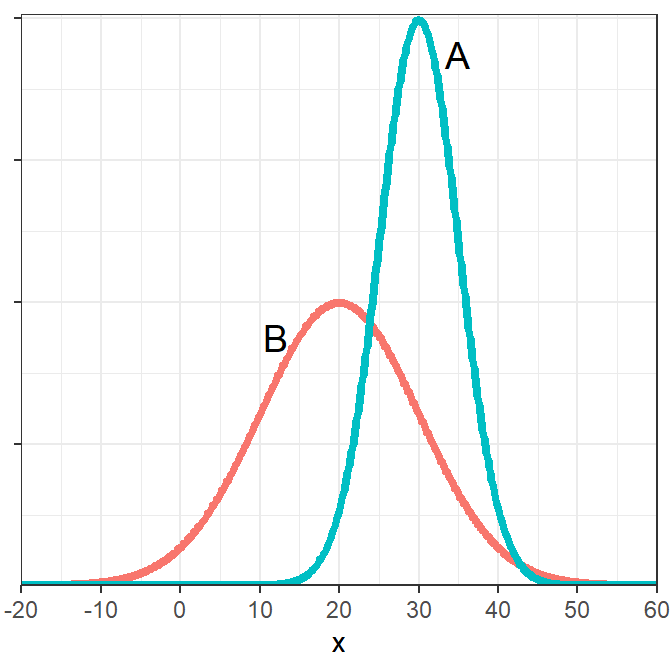
Normal Distribution Characteristics III
Identify the mean and standard deviation for each population on the graph below (HINT: “eyeball” integers).
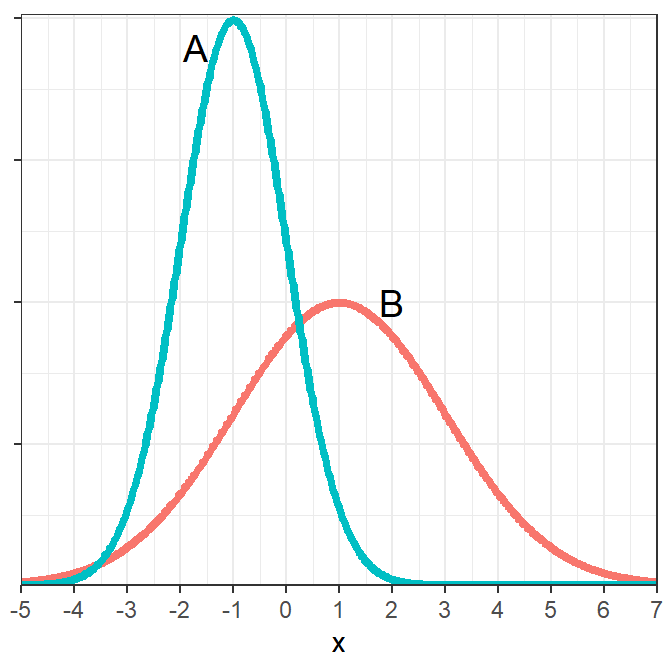
Normal Distribution Characteristics IV
Identify the mean and standard deviation for each population on the graph below (HINT: “eyeball” integers).
68-95-99.7 (Empirical) Rule
You can click on each question to see an answer. Click on it again to close the answer.
81.5% (using the results from the previous two questions … 100-16-2.5).
16% (Note that negative means less than 0, 0 is one σ below μ on this distribution, and 16% of individuals are less than one σ below μ.
16% (16% of individuals are less than one σ below μ.
16% (16% of individuals are greater than one σ above μ.
This question cannot be answered with the 68-95-99.7 Rule because 60 is not an integer number of σs away from μ.
Hand Calculations II
Answer each question below, without using R, assuming that Z~N(0,1). Show your work with a careful drawing for each question.
- What is the value of Z such that 16% of Z values are greater?
- What percent of Z values are greater than 2?
- What percent of Z values are less than 3?
- What is the most common 99.7% of Z values?