Acorn Production
- An individual is a “mature white oak tree in Bayfield County.”
- The individual is not an “acorn” because, as you will see in the next question, the variable is “number of acorns.” It does not make sense to record the “number of acorns” about an individual “acorn.” Always ask yourself if it makes sense to record the variable about the individual you have identified. If not, you likely do not have the correct individual.
- The variable is “number of acorns”, which is discrete (quantitative).
- μ=875 and σ=220.
- The population distribution is right-skewed.
- This is evident because it is about the oak trees (i.e., the individuals) and is given in the background with a “suppose” preface (i.e., we suppose or assume about things, like characteristics about a population, that cannot be known.)
In all of the following questions, I urge you to follow these steps when answering probability questions:
- Identify the distribution that would be used to answer the question (population or sampling).
- Identify characteristics of the required distribution; i.e., whether normal or not and, if normal, the center and dispersion (SD or SE).
- Identify whether the question can be answered or not (can be if normal, cannot be if not normal).
-
Answer to the question; use
distrib()if the probability can be computed (i.e., normal distribution) or explain why the probability cannot be computed (i.e., specifically note which distribution is not normal).
Keep this in mind as you consider the answers below.
- The probability that a sample of 50 oak trees will produce a mean greater than 900 acorns is 0.211.
- Sampling distribution because “sample of 50” and “a mean of”.
- N(875,\(\frac{220}{\sqrt{50}}\)) because n=50>30.
- Can be answered because sampling distribution IS normal.
- Used code below for this forward (given value of “x”) right-of (“more than”) question.
> distrib(900,mean=875,sd=220/sqrt(50),lower.tail=FALSE)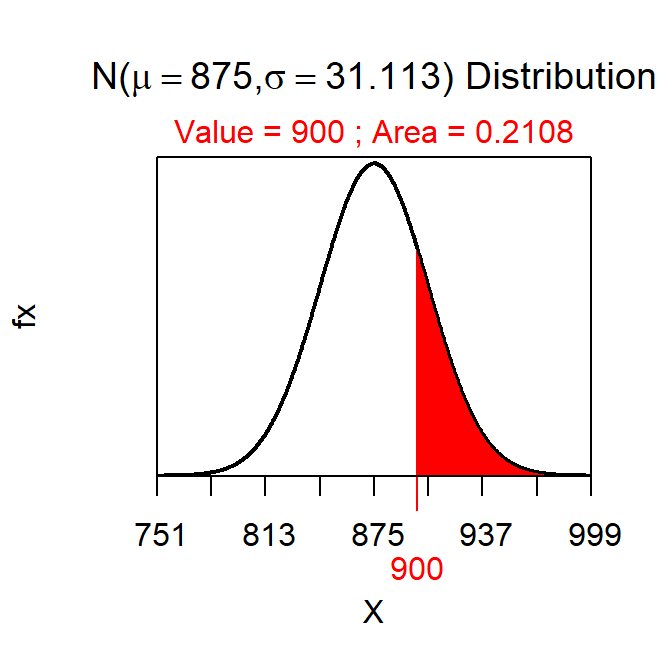
- The probability that a sample of 35 oak trees will produce a mean between 850 than 900 acorns is 0.499.
- Sampling distribution because “sample of 35” and “a mean of”.
- N(875,\(\frac{220}{\sqrt{35}}\)) because n=35>30.
- Can be answered because sampling distribution IS normal.
- Used code below for this forward (given value of “x”) between question (I suppressed the plots).
> ab <- distrib(900,mean=875,sd=220/sqrt(35))> a <- distrib(850,mean=875,sd=220/sqrt(35))> ab-a[1] 0.4985957- The probability that an oak tree will produce more than 1000 acorns cannot be answered because the population distribution is not normal.
- Population distribution because about “an oak tree.”
- The population distribution is not normal as stated in the background.
- Cannot answer this question because the population distribution is not normal.
- NA
- The probability that a sample of 20 oak trees will produce a mean with fewer than 1000 acorns cannot be answered because the sampling distribution is not normal.
- Sampling distribution because “sample of 20” and “a mean of”.
- Not normal because n<30 and population is strongly skewed (as stated in the background)
- Cannot answer this question because the sampling distribution is not normal according to the Central Limit Theorem.
- NA
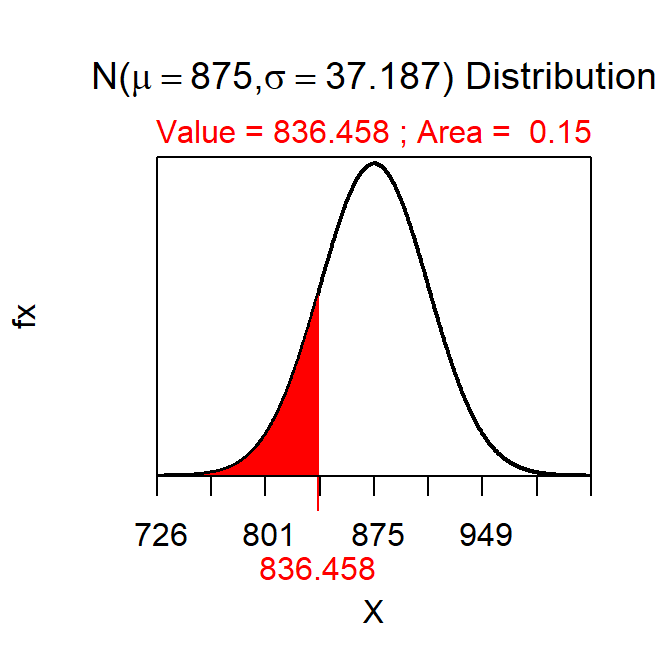
- There is a 15% probability that a sample of 35 oak trees will have a mean number of acorns produced greater than 836.5.
- Sampling distribution because “sample of 35” and “a mean of”.
- N(875,\(\frac{220}{\sqrt{35}}\)) because n=35>30.
- Can be answered because sampling distribution IS normal.
- Used code below for this reverse (given percent) “greater than” question.
> distrib(0.15,mean=875,sd=220/sqrt(35),type="q")