Identifying Hypotheses
When identifying the hypotheses note:
- Each statistical hypothesis must contain a parameter – either μ or p. That parameter must be defined (note the “where …” constructions below).
- Each statistical hypothesis must contain a specific value that the parameter is compared to.
- The null hypothesis (i.e., H0) must contain the equals sign. No other mathematical sign is allowed.
- The alternative hypothesis (i.e., HA must contain either the less than (<), greater than (>), or not equals (≠) sign. No other mathematical sign is allowed.
- HA μ > 15 vs. H0 μ = 15, where μ is the mean length of all oil changes at the Toyota dealership.
- HA μ ≠ 22500 vs. H0 μ = 22500, where μ is the mean cost of all bariatric surgeries.
- HA p > 0.61 vs. H0 p = 0.61, where p is the proportion of all Washburn High School students that are involved in at least one extracurricular activity.
- HA μ < 90 vs. H0 μ = 90, where μ is the mean number of murders for all burroughs in 2010.
P-Value Calculations and Decisions I
Note:
- When writing the definition of the p-value in the context of the problem you are replacing “the observed statistic” with the value of x̄; “more extreme” with “less”, “greater”, or “different” depending on the sign in HA; and the “null hypothesis is true” with the value of μ in “the probability of the observed statistic or a value more extreme assuming the null hypothesis is true.”
- The p-value is “the probability of observing a sample mean of 79.5 or greater if the population mean is 75.” Reject H0 because p-value=0.0040<α (Figure 1).
- The p-value is “the probability of observing a sample mean of 13700 or less if the population mean is 15000.” Do not reject H0 because p-value=0.1253>α (Figure 2).
- The p-value is “the probability of observing a sample mean of 11.2 or ‘different’ if the population mean is 14.” Reject H0 because p-value=0.0196<α (Figure 3).
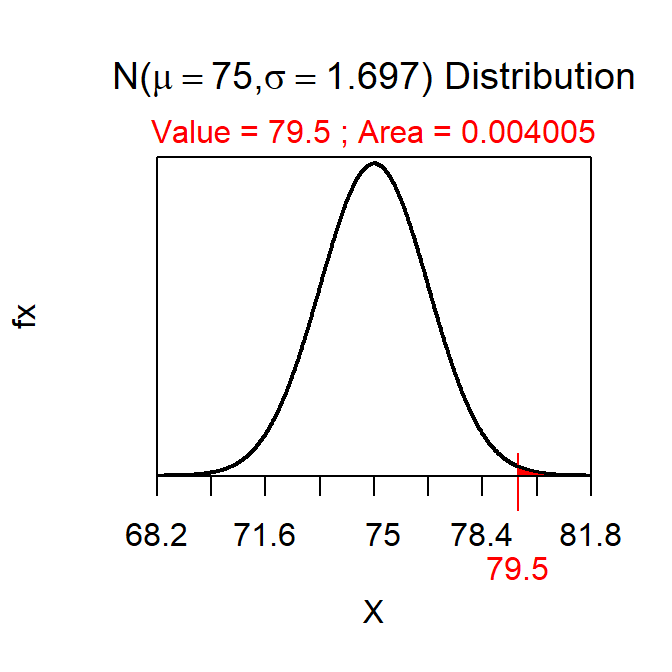
Figure 1: Normal distribution representing the p-value calculation for the first example.
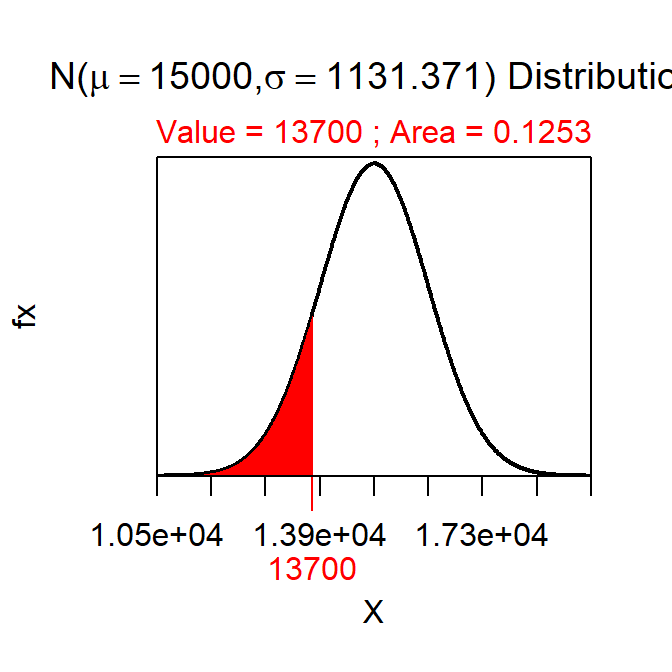
Figure 2: Normal distribution representing the p-value calculation for the second example.
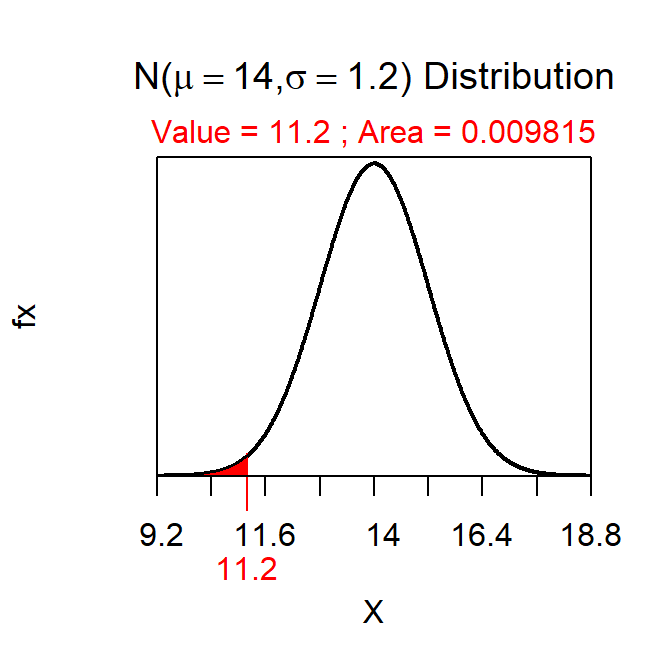
Figure 3: Normal distribution representing the p-value calculation for the third example.
R Appendix.
distrib(79.5,mean=75,sd=12/sqrt(50),lower.tail=FALSE)
distrib(13700,mean=15000,sd=8000/sqrt(50))
2*distrib(11.2,mean=14,sd=6/sqrt(25))