The Concept of Confidence Intervals
- The percentage of CIs that contained μ was not affected by (i.e., did not change) increasing n.
- The percentage of CIs that contained μ increased with an increasing level of confidence.
- The margin-of-error decreased with increasing n (i.e., the confidence interval became narrower).
- The margin-of-error increased with increasing level of confidence (i.e., the confidence interval became wider).
- As a statistician you can make the CI narrower by increasing your sample size (n) or decreasing the level of confidence (C). Decreasing the level of confidence, however, will result in more errors in your conclusions (i.e., μ will be contained within the confidence interval less often).
Confidence Region Calculations
Note:
- The level of confidence comes from 1-α
- The type of confidence region comes from the HA: a “less than” HA is an upper bound, a “greater than” HA is a lower bound, and a “not equals” HA is an interval.
-
The Z* uses the level of confidence in
distrib()for the bounds but the “tail area” must be used for the intervals. Look closely at the R Appendices, especially for the interval questions.
- See below.
- C=0.90
- Lower bound
- Z*=-1.282 (Figure 1).
- 77.3 (this is 79.5-1.282\(\frac{12}{\sqrt{50}}\)).
- I am 90% confident that the true population mean is greater than 77.3.
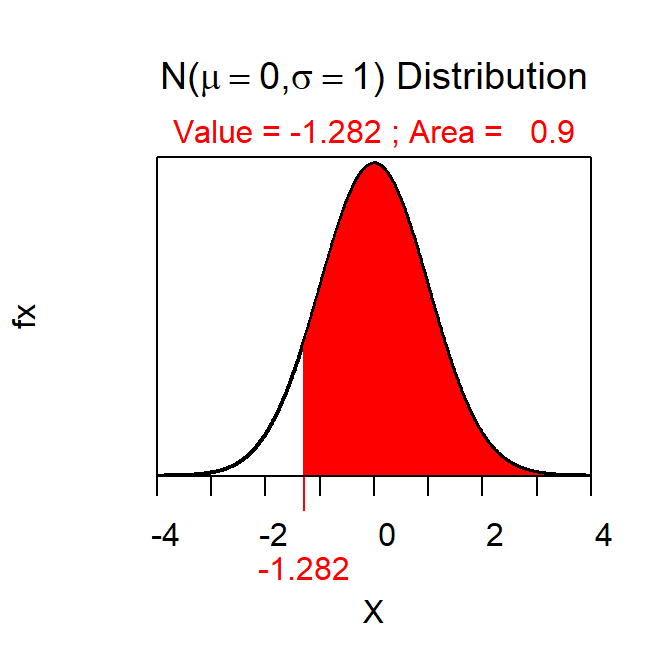
Figure 1: Normal distribution representing the Z* the first confidence region example.
- See below.
- C=0.95
- Interval
- Z*= ± 1.960 (Figure 2).
- 8.8-13.6.
- I am 95% confident that the true population mean is between 8.8 and 13.6.
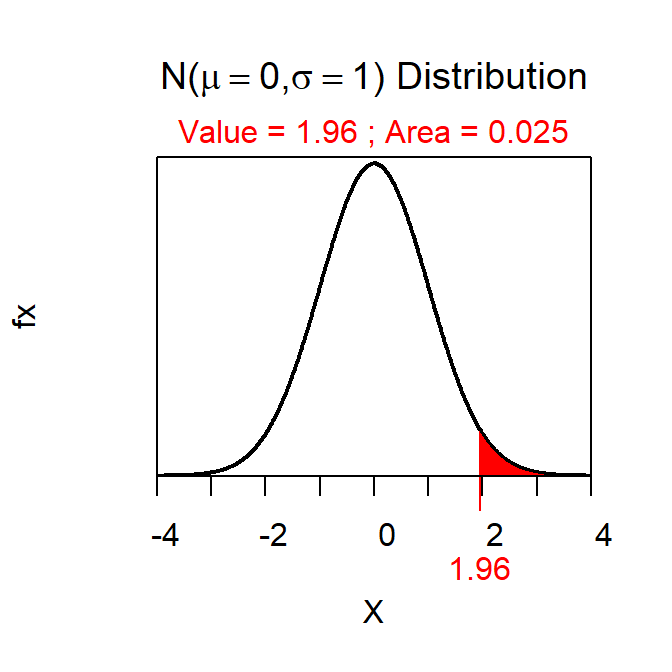
Figure 2: Normal distribution representing the Z* the second confidence region example.
- See below.
- C=0.99
- Lower bound
- Z*=-2.326 (Figure 3).
- 894.6.
- I am 99% confident that the true population mean is greater than 894.6.
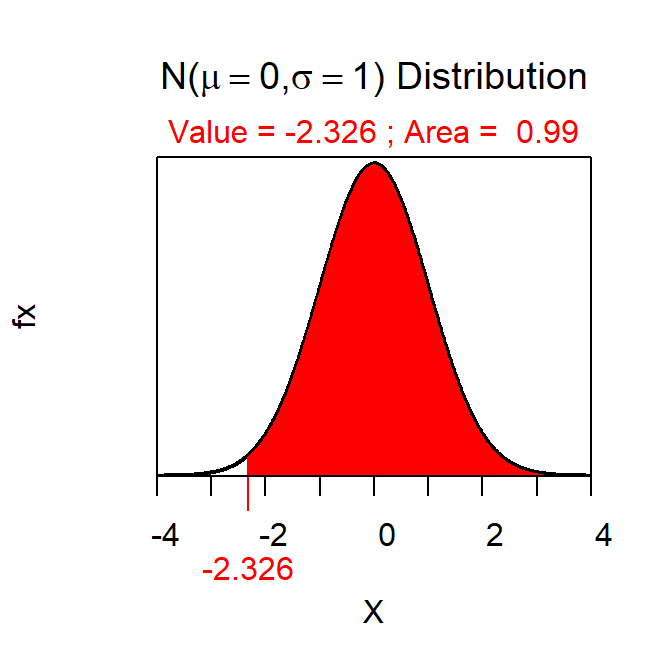
Figure 3: Normal distribution representing the Z* the third confidence region example.
- See below.
- C=0.90
- Upper bound
- Z*=1.282 (Figure 4).
- 15150.4.
- I am 90% confident that the true population mean is less than 15150.4.
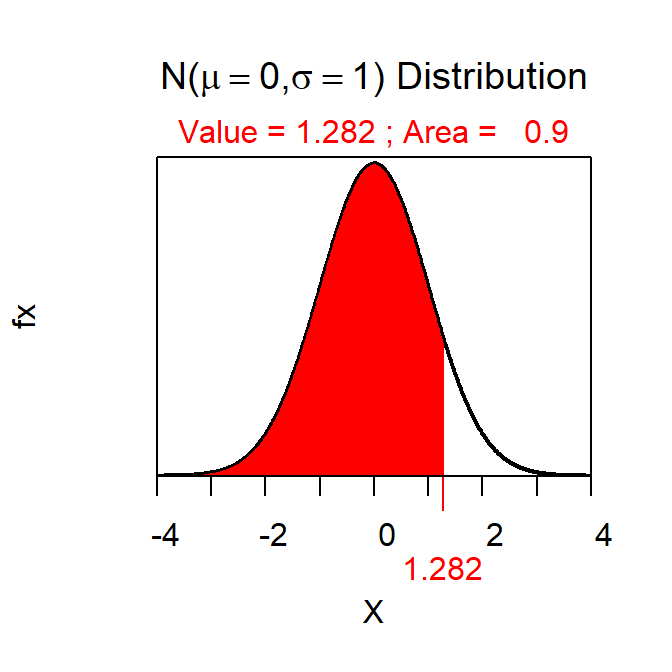
Figure 4: Normal distribution representing the Z* the fourth confidence region example.
R Appendix
zstar <- distrib(0.9,type="q",lower.tail=FALSE)
zstar <- distrib(0.025,type="q",lower.tail=FALSE)
zstar <- distrib(0.99,type="q",lower.tail=FALSE)
zstar <- distrib(0.9,type="q")