An analysis of every tank of gas that I have put in my truck.
Gas
Vis
Author
Derek H. Ogle
Published
Feb 2, 2023
Modified
Jan 2, 2024
In late September 2016 I bought a Ford F-150 (Figure 1). This was one of the first versions of the aluminum bodied trucks. For that reason, and just out of curiosity, I kept data relative to every tank of gas that I have put into the truck.
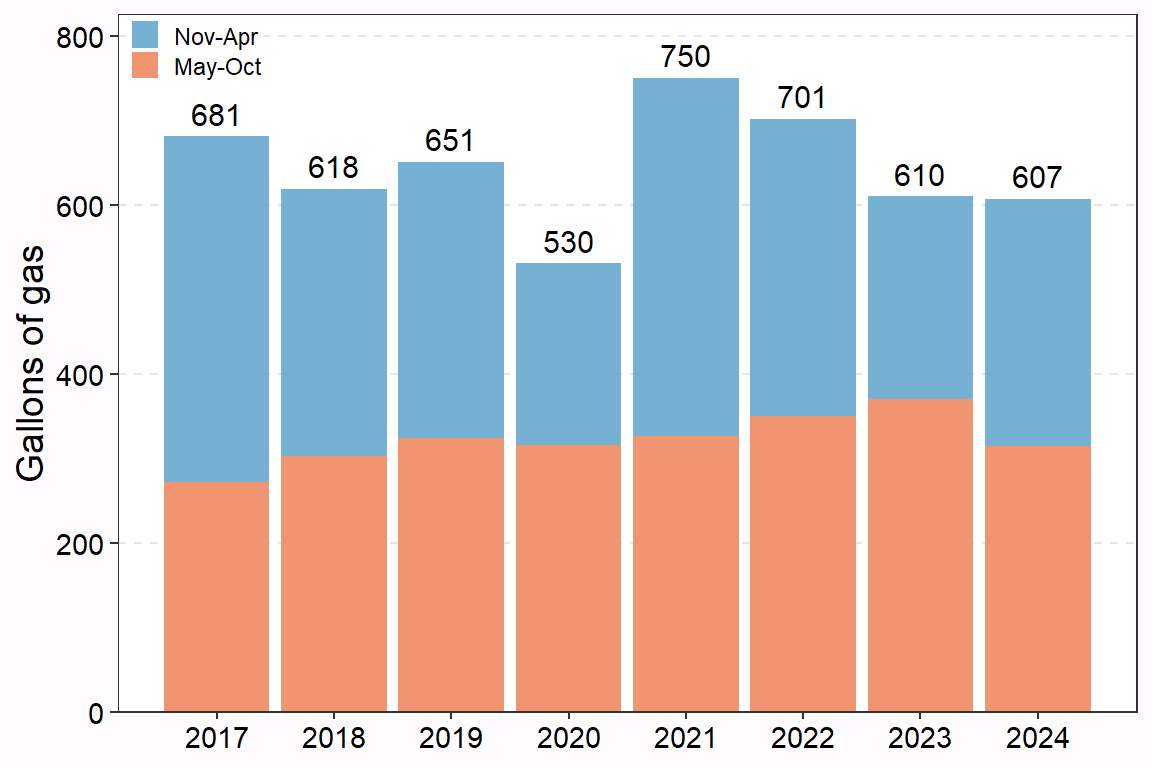
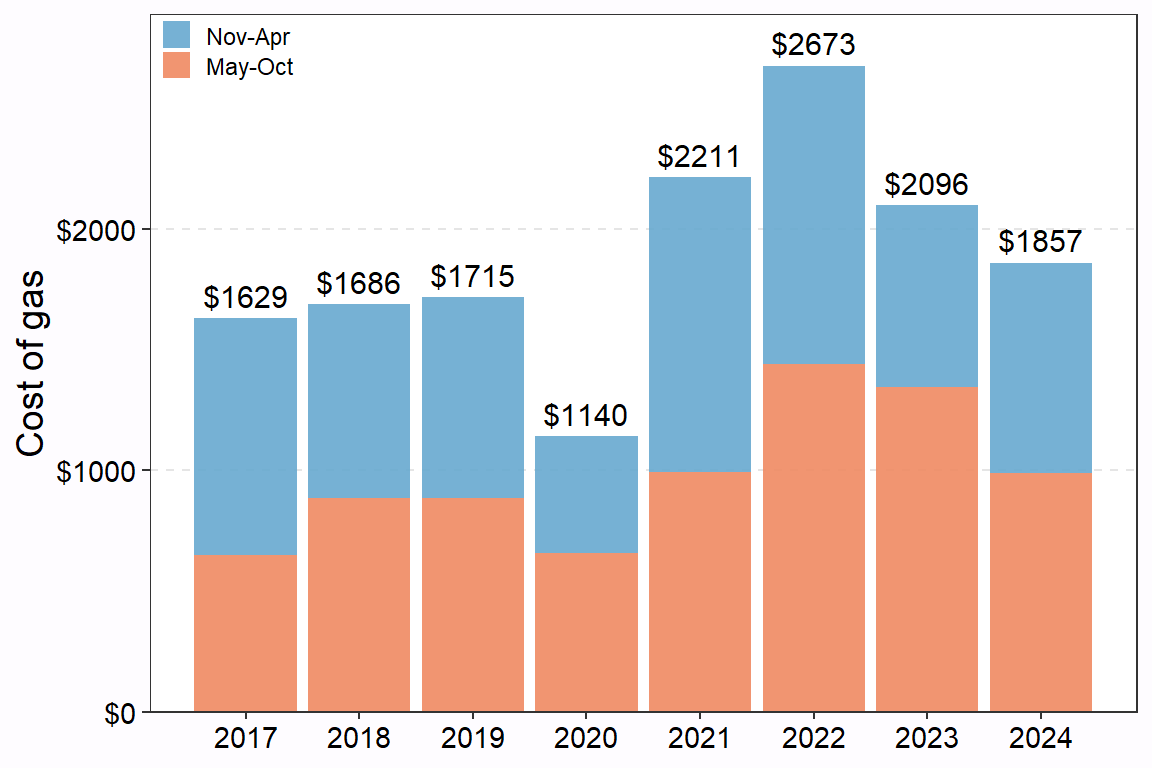
6,360.6 gallons of gas purchased at a total of $18,686.90 (see Figure 4 and Figure 5)
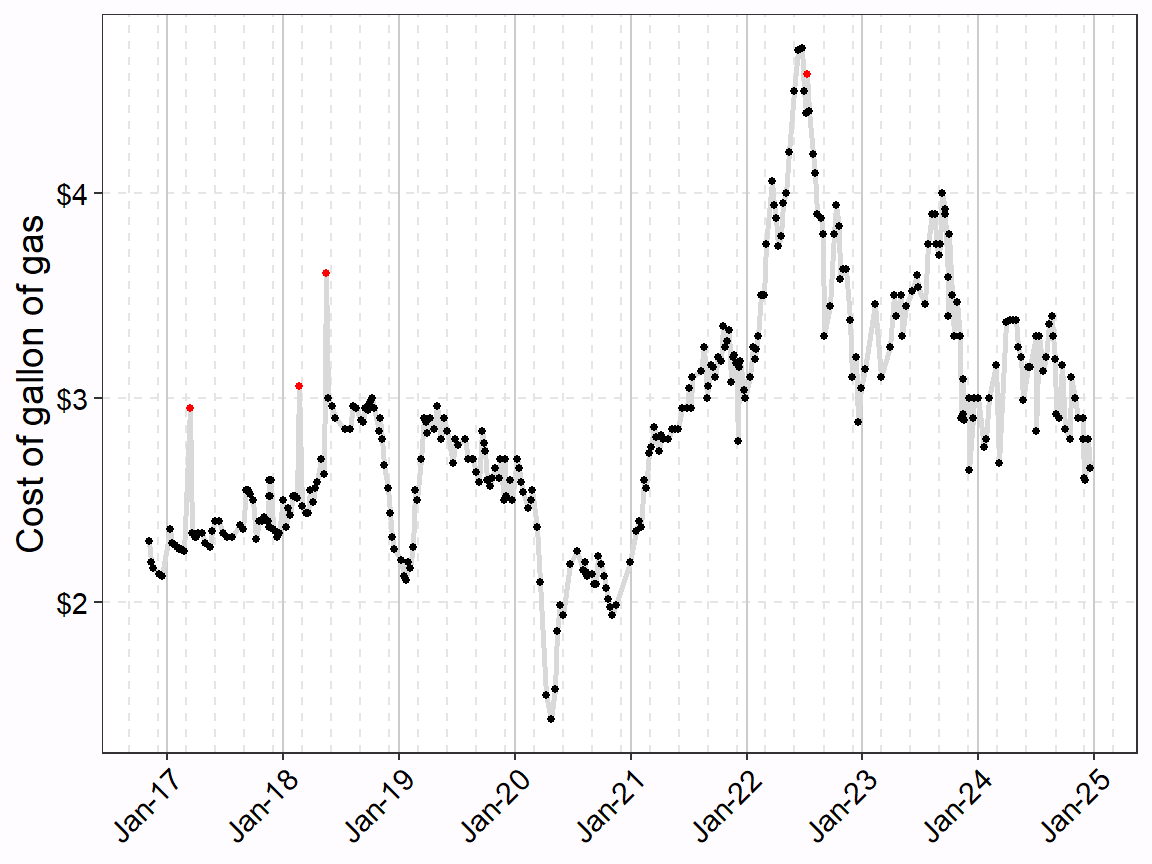
The price of gas ranged from $1.43 on April 24, 2020 to $4.71 on June 24, 2022 (see Figure 7)
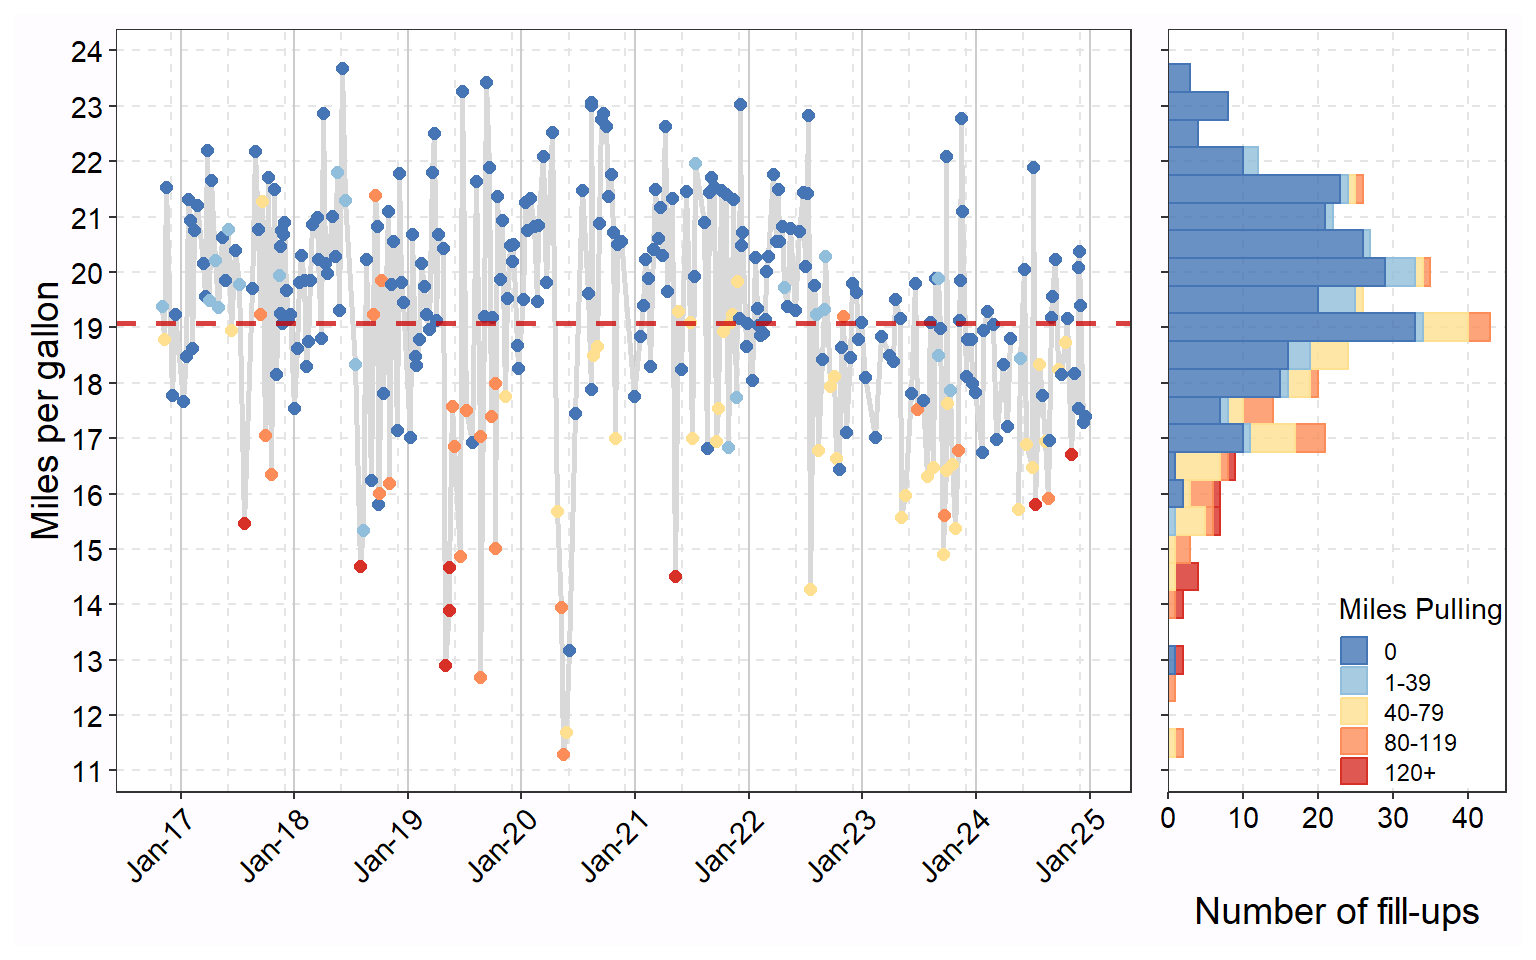
Overall, averaged 18.9 miles per gallon (see Figure 8 and Figure 9); 19.7 when not pulling anything
More detailed results are below.
Figure 1: My 2016 Ford F-150.
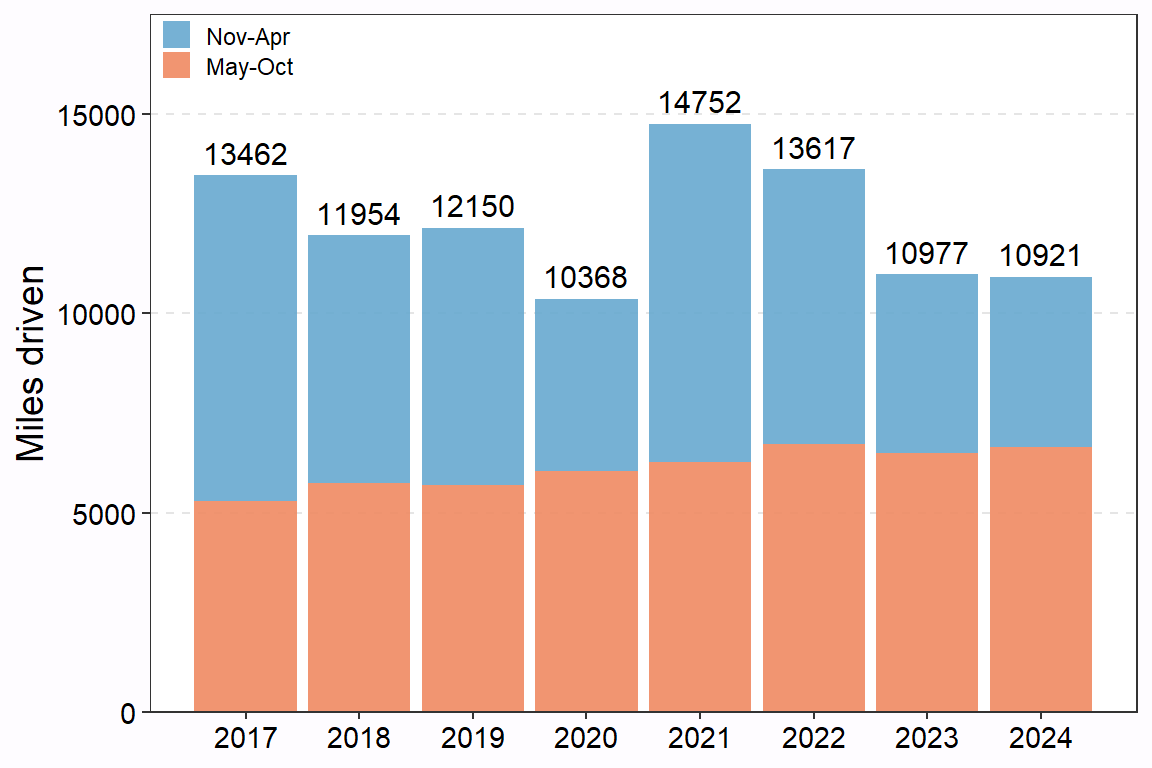
Miles Driven
Figure 2: Total miles driven per year separated by ‘warm’ and ‘cold’ months. Note that 2020 was the ‘Covid’ year.
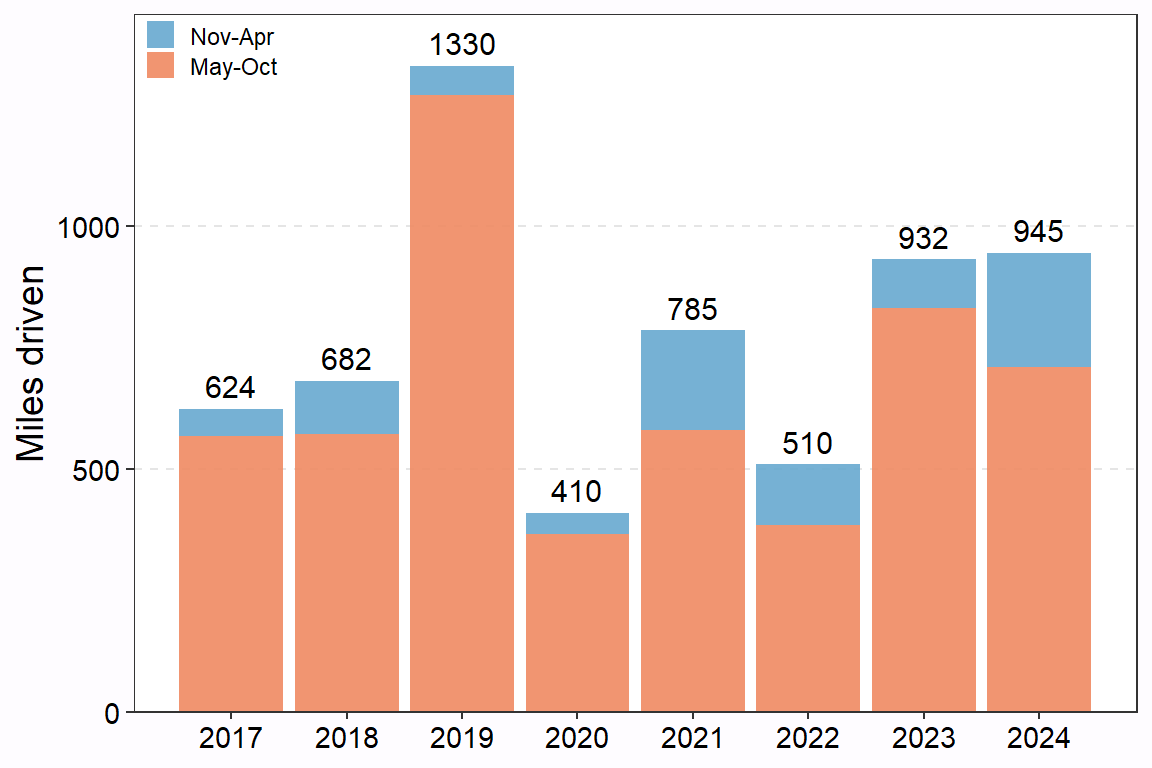
Figure 3: Total miles driven per year pulling something (boat, tractor, etc.) separated by ‘warm’ and ‘cold’ months. Note that 2020 was the ‘Covid’ year.
Gas Costs
Figure 4: Total gallons of gas purchased per year separated by ‘warm’ and ‘cold’ months. Note that 2020 was the ‘Covid’ year.
Figure 5: Total cost of gas purchased per year separated by ‘warm’ and ‘cold’ months. Note that 2020 was the ‘Covid’ year.
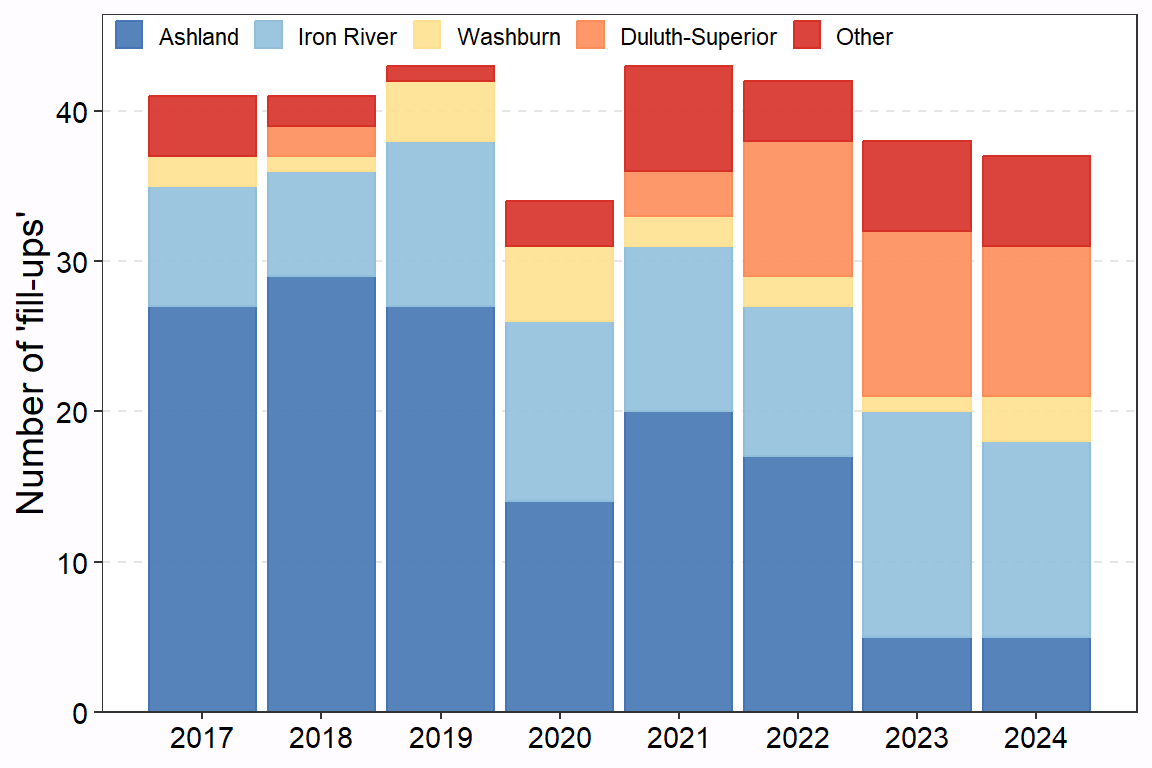
Figure 6: Number of ‘fill-ups’ per year separated into major towns. Note that 2020 was the ‘Covid’ year.
Figure 7: Cost per gallon of gas by individual tank of gas. Tanks where premium gas was purchased are highlighted. Note that 2020 was the ‘Covid’ year.
Gas Mileage
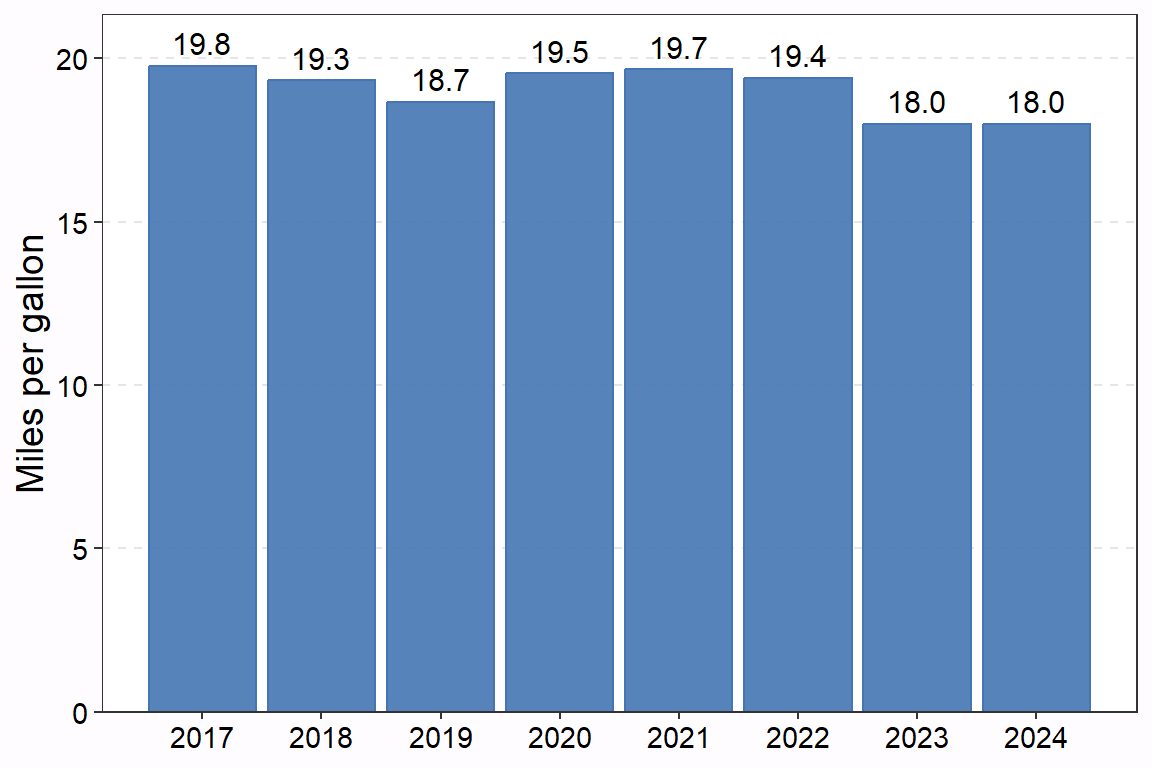
Figure 8: Average miles per gallon by year.
Figure 9: Miles per gallon for individual tanks of gas separated by categories of miles pulling something. The red dashed line is the overall average miles per gallon.