Lake Nebagamon Ice

An analysis of ice-in and out data for Lake Nebagamon, WI since 1943.
Climate/Weather
Limnology
Vis
Author

Derek H. Ogle

Published

Feb 4, 2023

Modified

Mar 31, 2024

Summary
  • Lake Nebagamon, in Douglas County, is 986 acres with a maximum depth of 56 feet.
  • Ice-in and out dates recorded from 1943 to 2023.
  • The average ice-in date is Nov 29 and the average ice-out date is Apr 19 (see Figure 1).
  • The range for both ice-in (Nov 7 to Dec 26) and ice-out (Mar 13 to May 14) dates is considerable, at approximately six to eight weeks (see Figure 1).
  • There are weak indications for a slightly later ice-in date and, possibly, a slightly earlier ice-out date in the last two decades (see Figure 2).
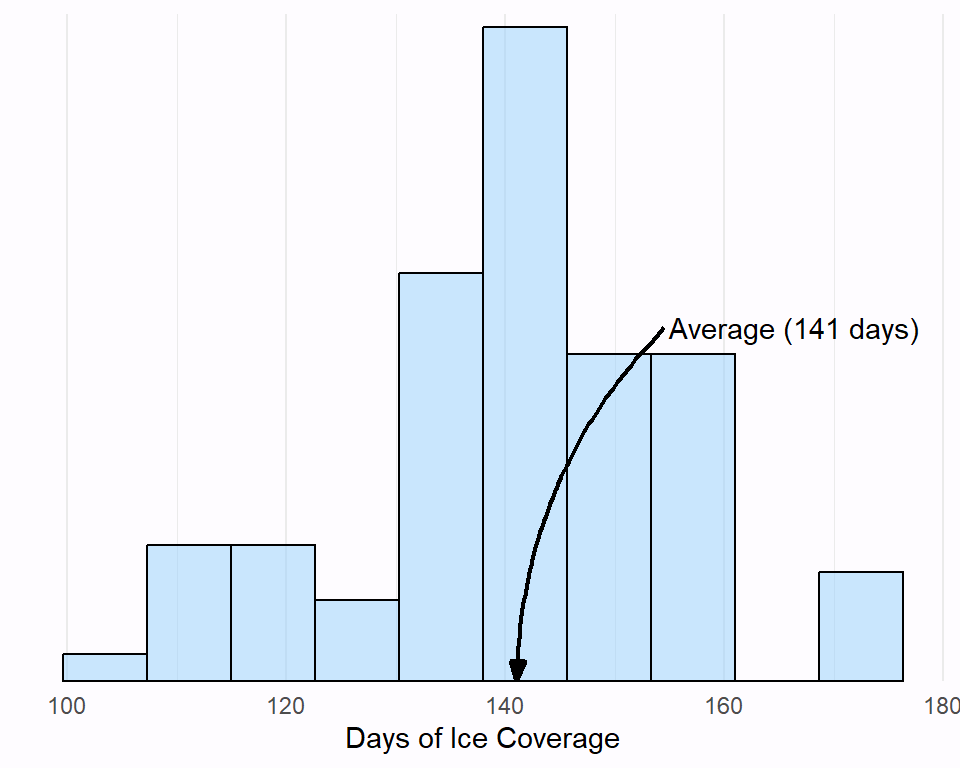
  • Since 1943 the average days of ice coverage was 141 days, though the range was considerable from 105 to 174 days (see Figure 3).
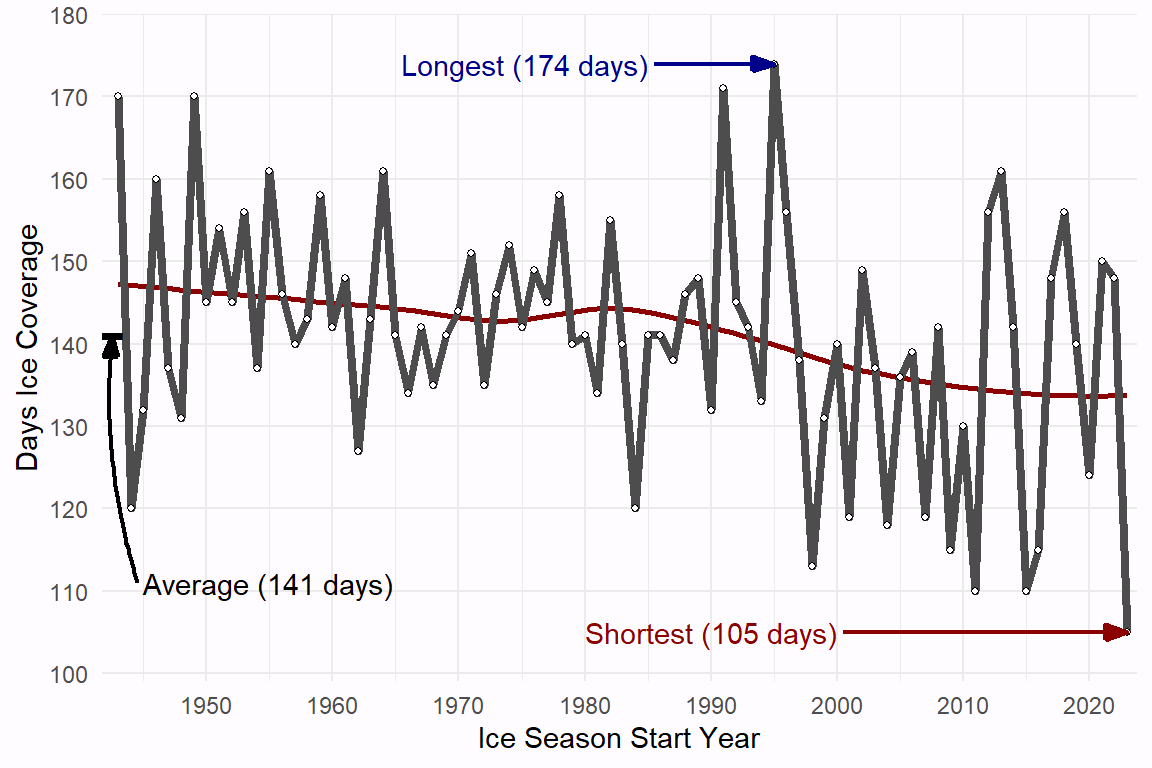
  • There is an indication that the length of ice duration has declined, on average, by a little over a week in the last two decades (see Figure 4).
  • Eight of the ten shortest ice duration seasons have occurred since 2000 (see Table 1), whereas only one of the ten longest ice duration seasons have occurred in that same time period (see Table 2).
  • Data were provided by Gary Hagstrom who received it from XXX. The original data acknowledged J Arthur, G DeBrunye, W Kiefer, A Mack, M Laskkowski, J Snydle.


Ice In and Out Dates
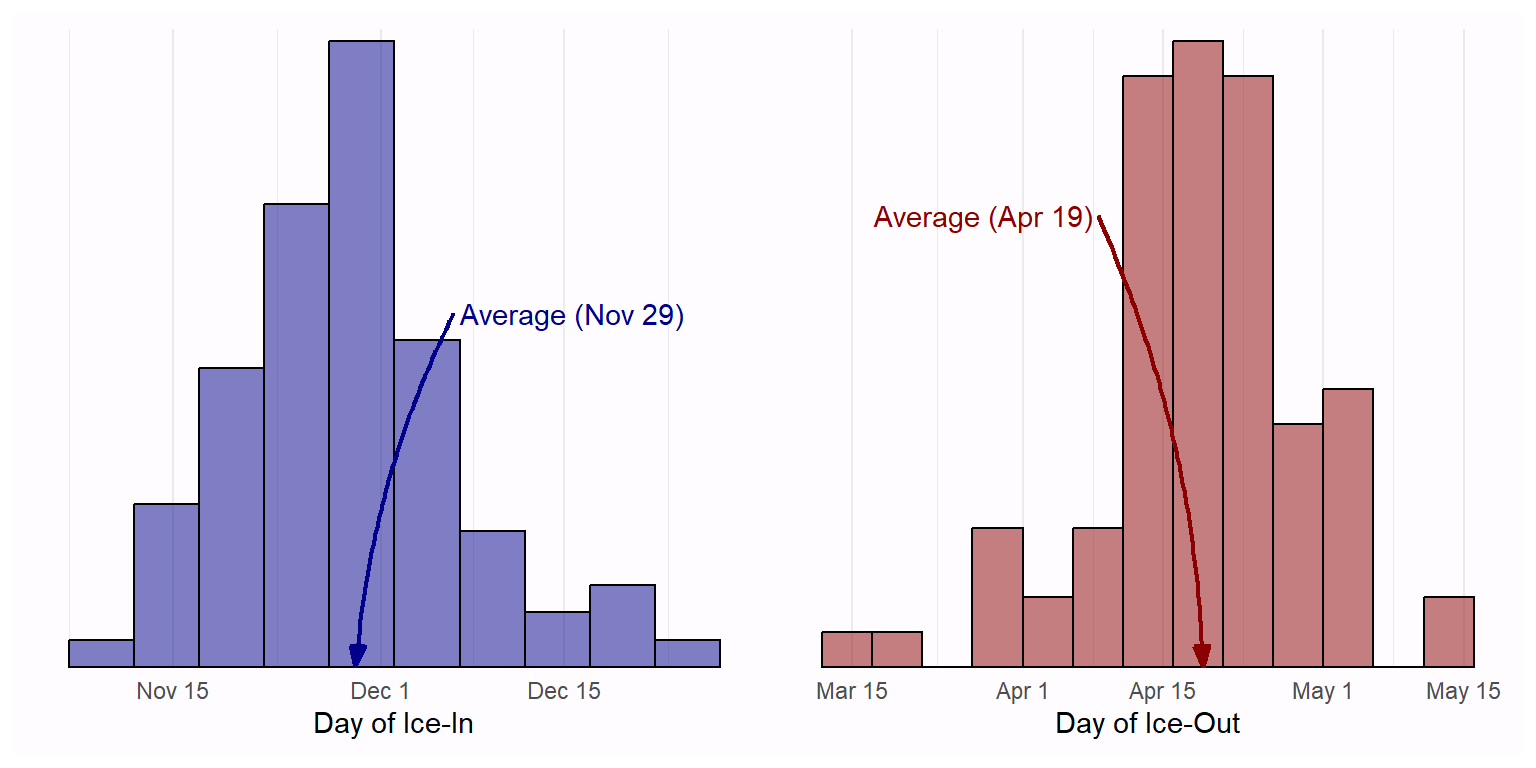
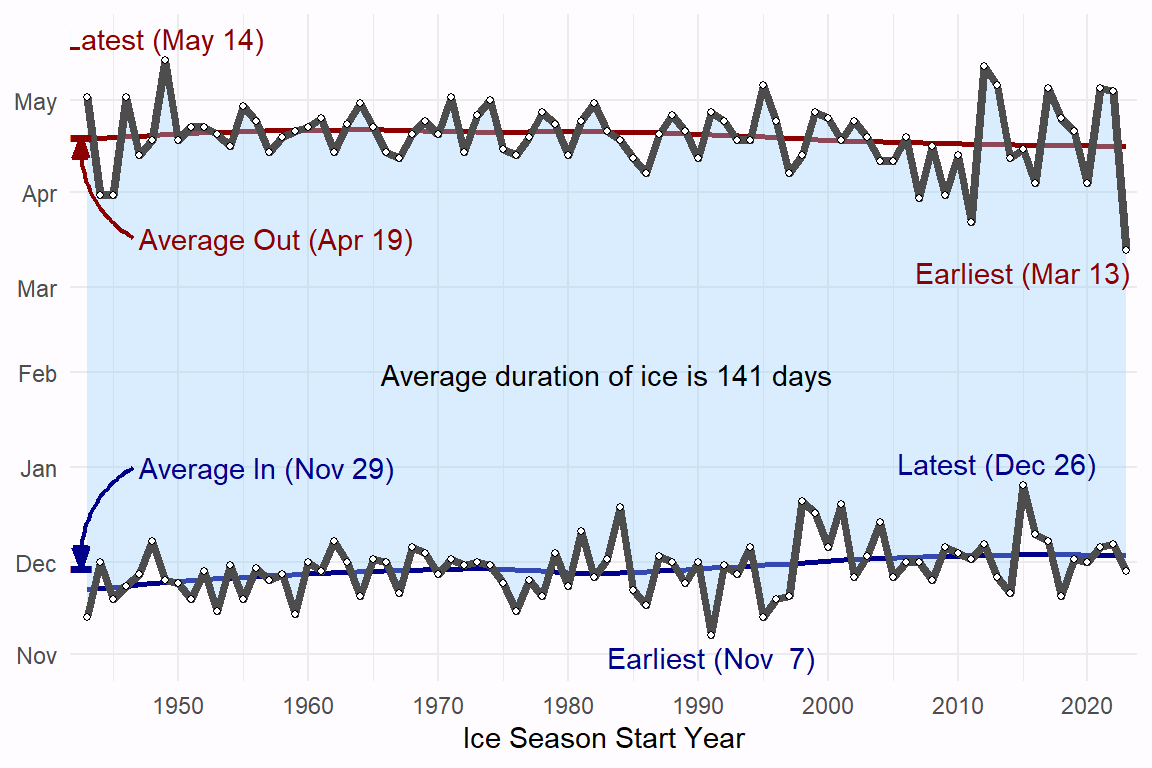
Figure 1: Lake Nebagamon ice in and out dates, 1943-2023.
Figure 2: Lake Nebagamon ice in and out dates by year.

Ice Duration

Figure 3: Lake Nebagamon ice durations, 1943-2023.
Figure 4: Lake Nebagamon ice duration by year.


Season In Out Duration
2023-2024 Nov 28 Mar 12 105
2011-2012 Dec 2 Mar 21 110
2015-2016 Dec 26 Apr 14 110
1998-1999 Dec 21 Apr 13 113
2009-2010 Dec 6 Mar 31 115
2016-2017 Dec 10 Apr 4 115
2004-2005 Dec 14 Apr 11 118
2001-2002 Dec 20 Apr 18 119
2007-2008 Dec 1 Mar 29 119
1944-1945 Dec 1 Mar 31 120
1984-1985 Dec 19 Apr 18 120
Table 1: Winter seasons with the 10 shortest ice durations, 1943-2023.


Season In Out Duration
1995-1996 Nov 13 May 5 174
1991-1992 Nov 7 Apr 26 171
1943-1944 Nov 13 May 1 170
1949-1950 Nov 25 May 14 170
1955-1956 Nov 19 Apr 28 161
1964-1965 Nov 20 Apr 30 161
2013-2014 Nov 26 May 6 161
1946-1947 Nov 23 May 2 160
1959-1960 Nov 14 Apr 20 158
1978-1979 Nov 20 Apr 27 158
Table 2: Winter seasons with the 10 longest ice durations, 1943-2023.