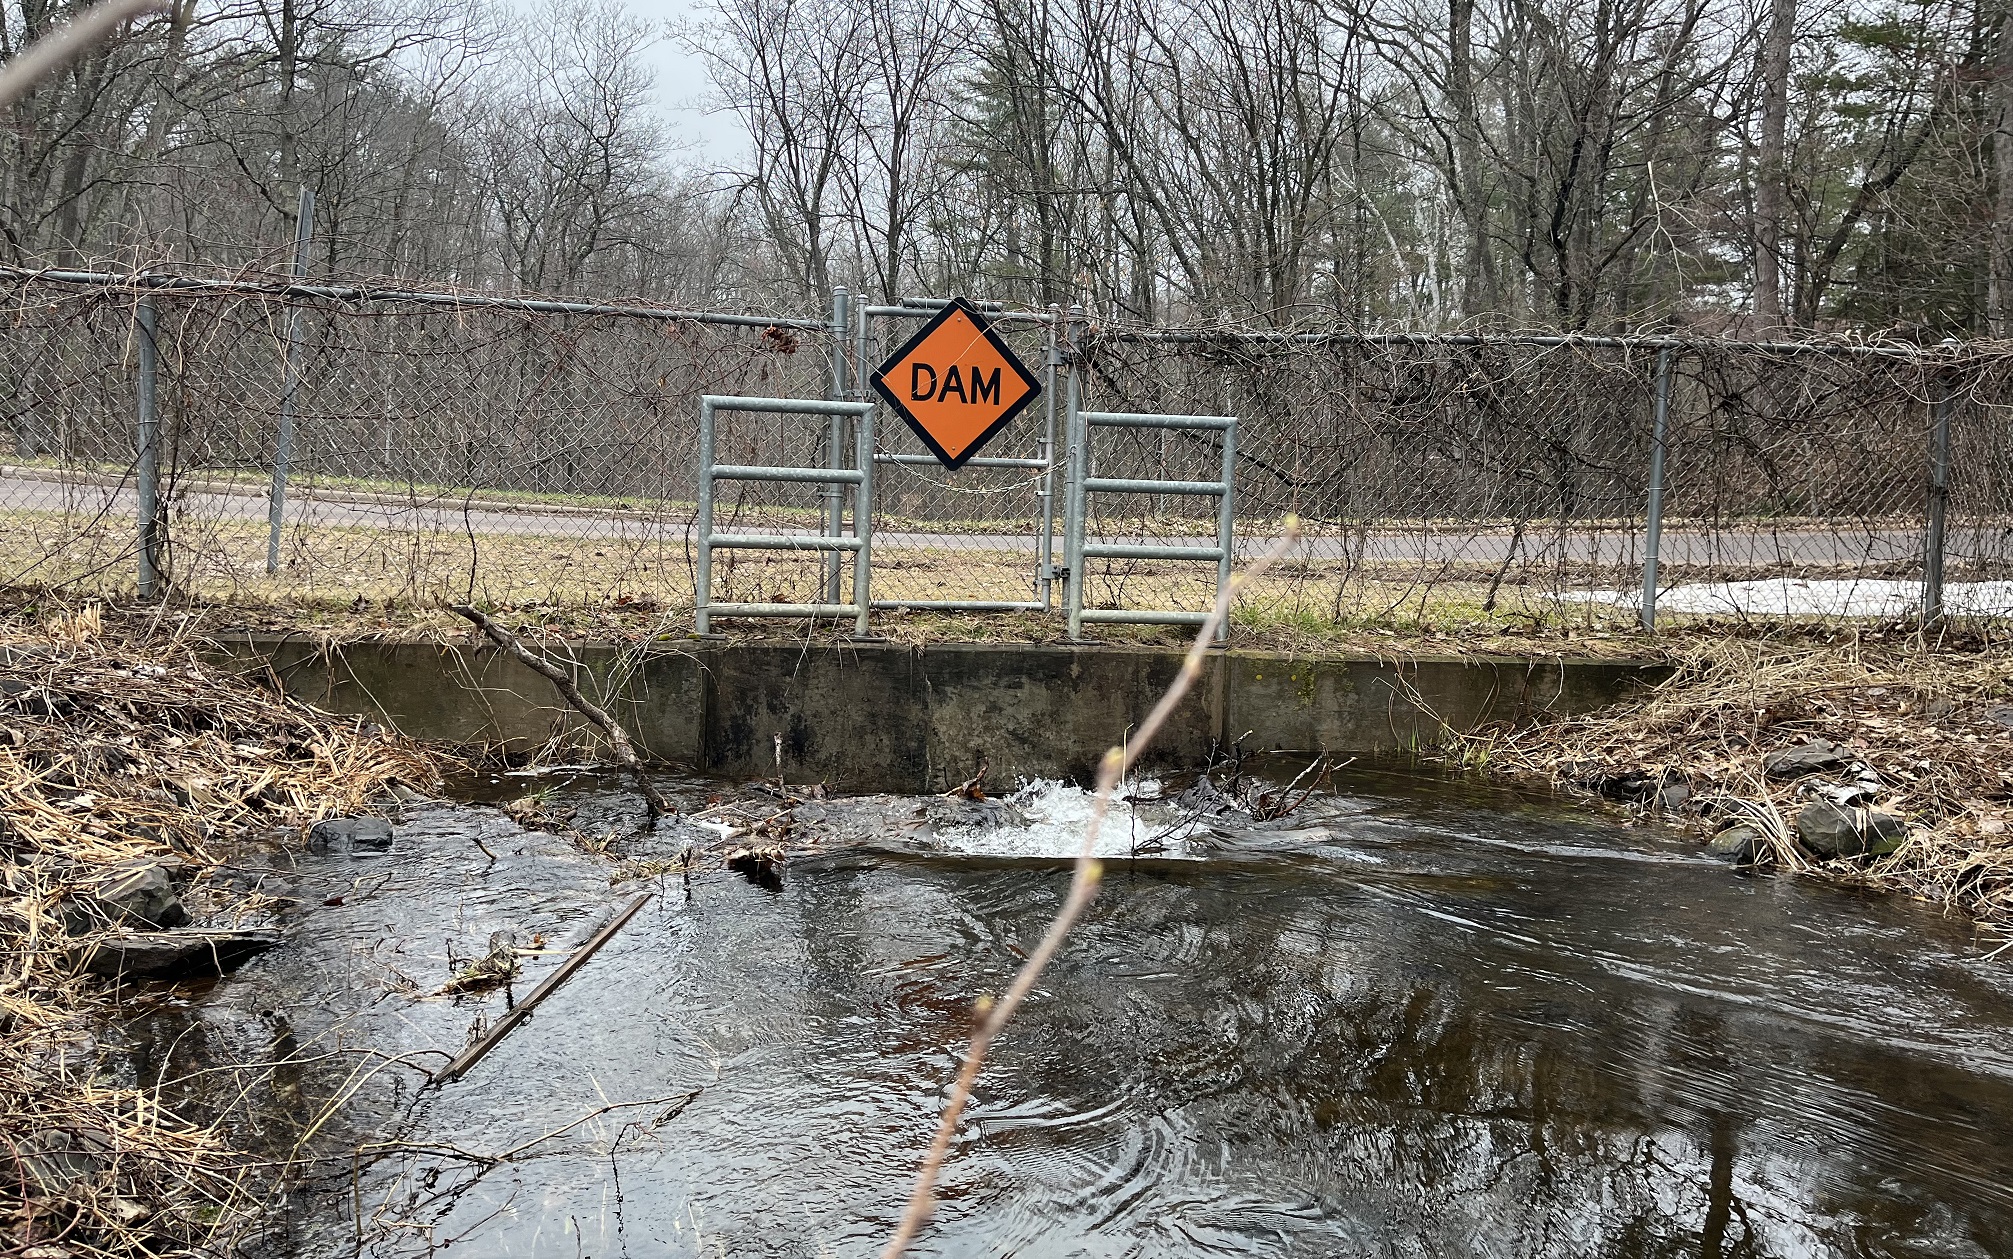
The winter of 2022-23 was exceptionally snowy in northern Wisconsin (see this). Landowners around the Pike Lake Chain expressed concerns about high water levels on the lakes soon after ice-out that year as “beaches” and docks were under water. A relative depth gauge is affixed to a permanent “wall” a few feet upstream from the dam on Flynn Lake (i.e., the outlet of the Pike Lake Chain). With the help of some friends (see Acknowledgments below), I now have near daily water level measurements at the gauge from May 2, 2023 to July 13, 2026. I hope these data will help us better understand both typical and atypical water levels on the lakes. My analysis and interpretation of these data are below. More information about the data collection is further below.
Water Level
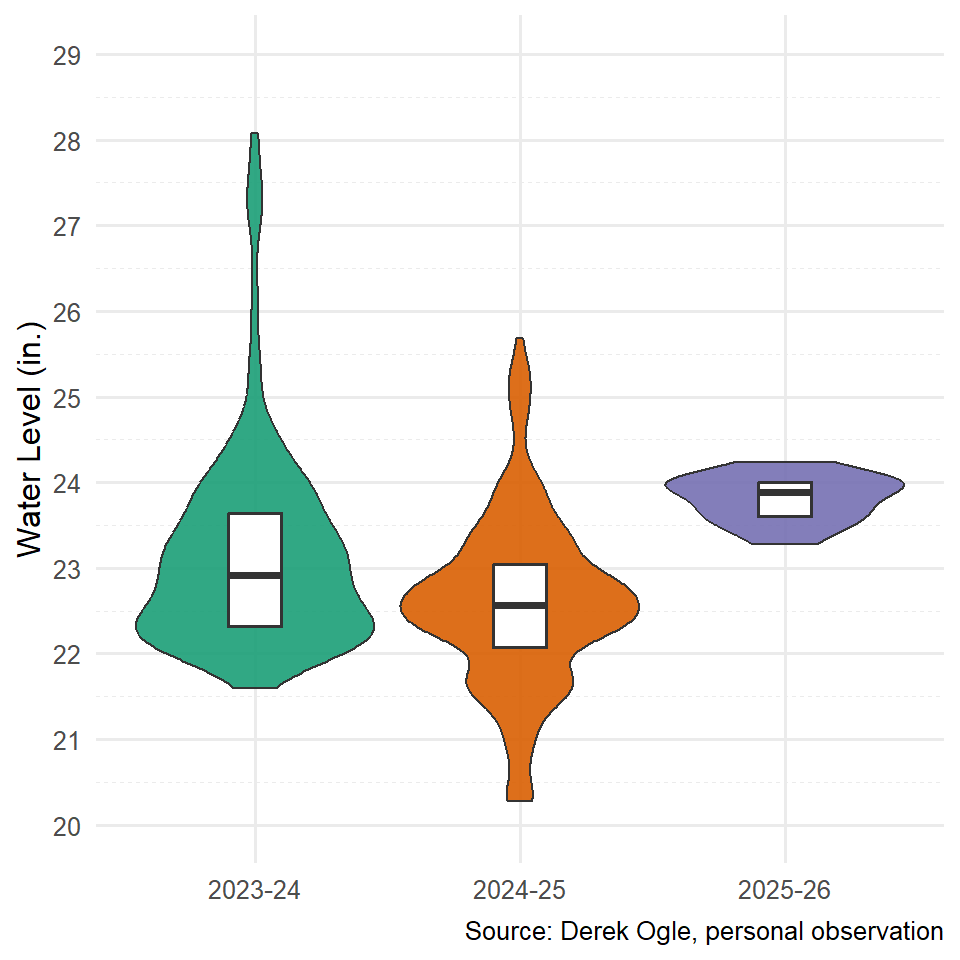
It is difficult to make definitive conclusions from only three complete ice-out to ice-out seasons. However, a few preliminary thoughts are:
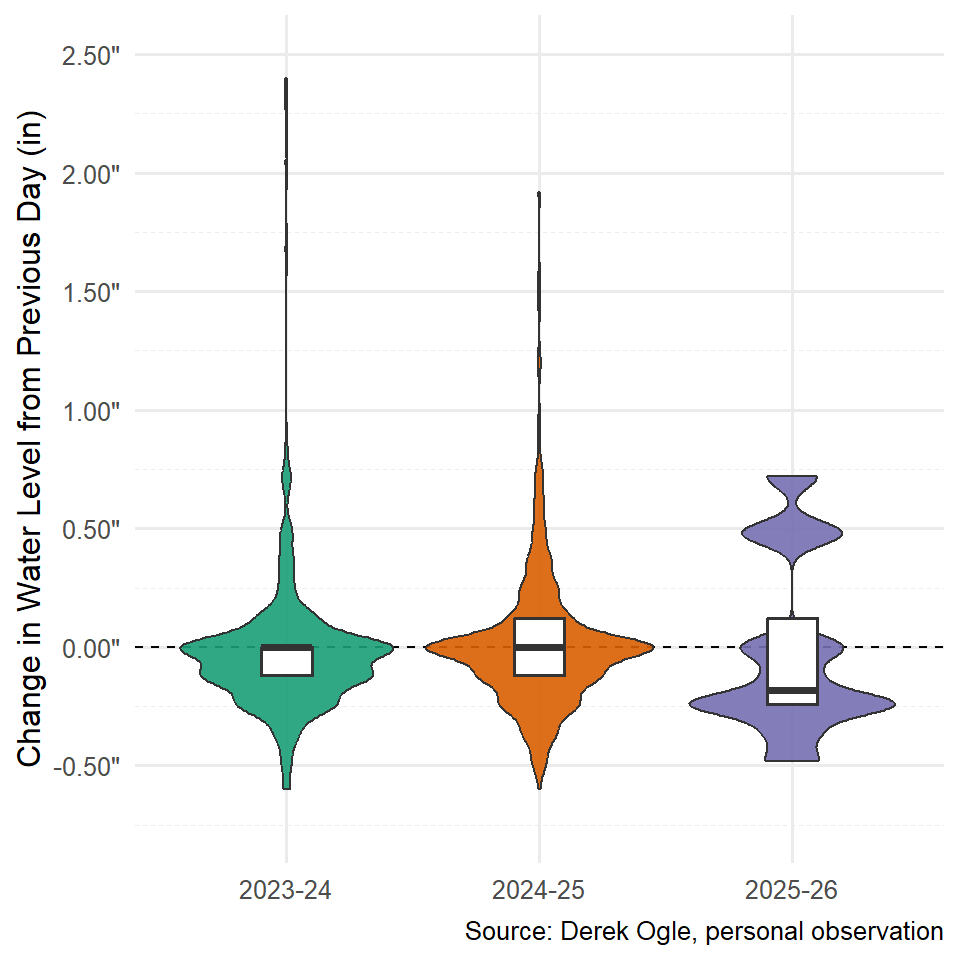
- Median water levels over the season appear to be around 22.5-23.0” (Figure 2; Table 1).
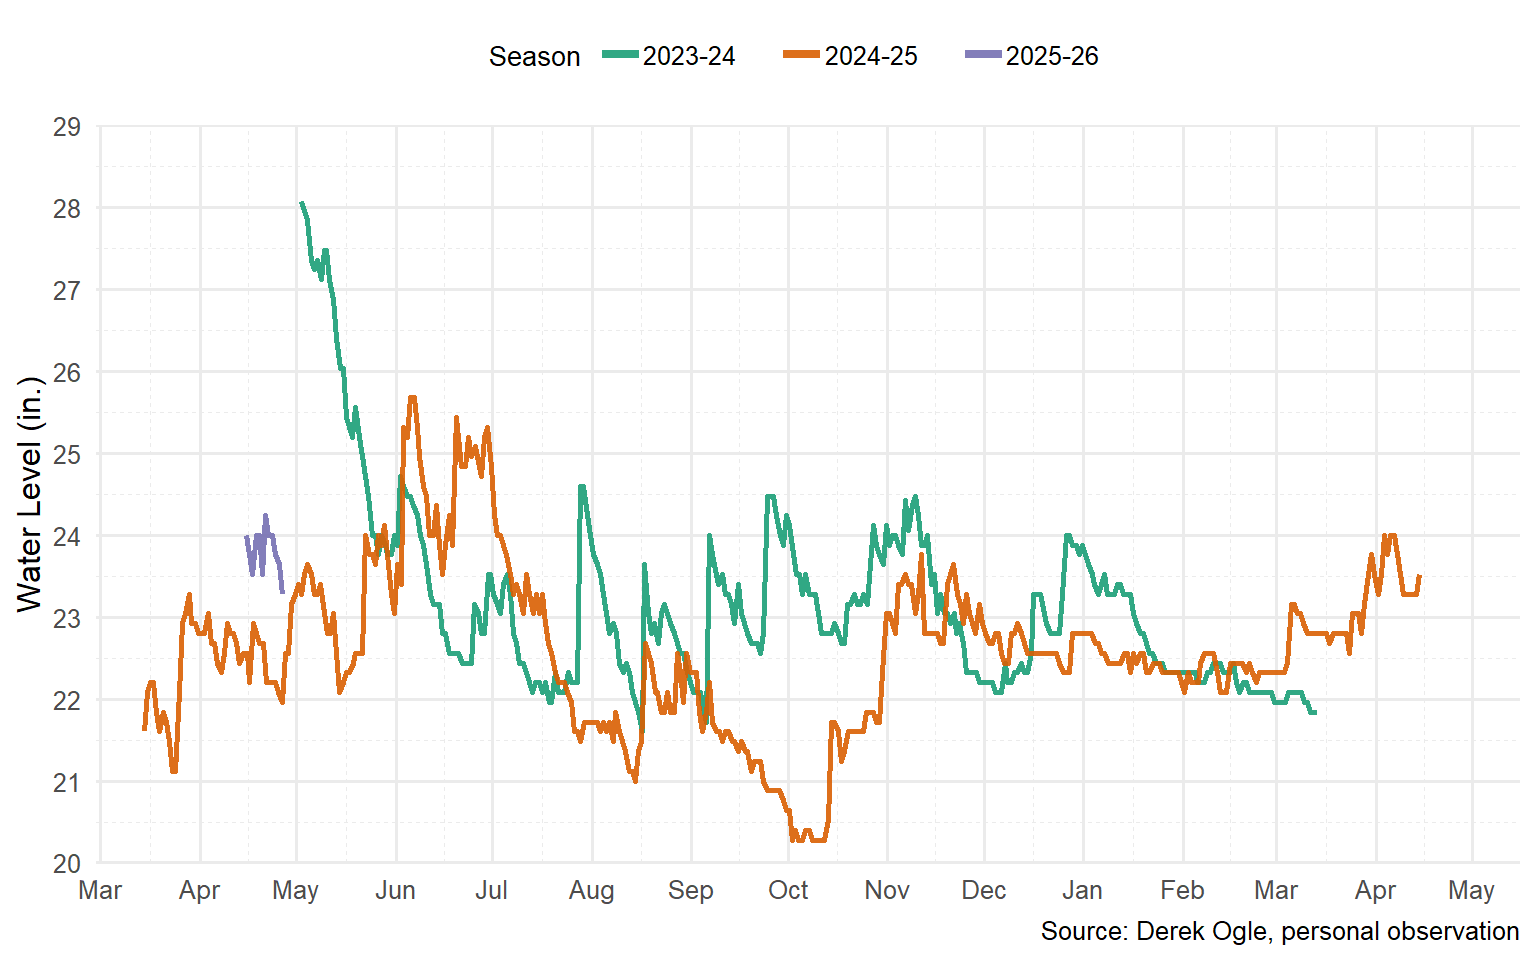
- There is considerable year-to-year variability (Figure 1; Figure 2), even during the middle of “summer” or “winter” when I expected the levels to be fairly consistent across years.
- Water levels are dependent on rainfall (not surprisingly!). The levels at the start of the 2023-24 season were elevated due to near record snowfalls the previous winter, whereas the lowest recordings (thusfar) were at the end of the summer for the 2024-25 season when we experience near drought-like conditions (Figure 1).
- The water level at the beginning of 2023-24 (i.e., end of 2022-23 winter) may have been atypically high as it was at least 5” higher than the water level at ice-out in 2024-25, 4” higher than the water level at ice-out in 2025-26, and 3” higher than any other water level recorded in 2023-24 after the initial peak had subsided (Figure 1; Table 1). Furthermore, the water level dropped rather quickly in spring of 2023 suggesting that there was excess water in the system that simply needed time to be flushed out (Figure 1).
| Season |
Date
|
Water Level
|
Max Change
|
|||||||||
|---|---|---|---|---|---|---|---|---|---|---|---|---|
| Start | End | Start | End | Median | 10% | 90% | Min | Max | Range | Drop | Rise | |
| 2023-24 | May 2 | Mar 13 | 28.1 | 21.8 | 22.9 | 22.1 | 24.4 | 21.6 | 28.1 | 6.5 | 0.60 | 2.40 |
| 2024-25 | Mar 14 | Apr 14 | 21.6 | 23.5 | 22.6 | 21.5 | 23.8 | 20.3 | 25.7 | 5.4 | 0.96 | 1.92 |
| 2025-26 | Apr 15 | Apr 17 | 24.0 | 22.8 | 22.0 | 20.8 | 23.3 | 20.2 | 25.0 | 4.8 | 0.48 | 2.40 |
| 2026-27 | Jun 13 | Jul 13 | 23.3 | 21.4 | 22.4 | 21.5 | 23.9 | 20.9 | 25.0 | 4.1 | 0.48 | 2.52 |
| Overall | — | — | — | — | 22.4 | 21.5 | 24.0 | 20.2 | 28.1 | 7.9 | 0.96 | 2.52 |
Change in Water Level
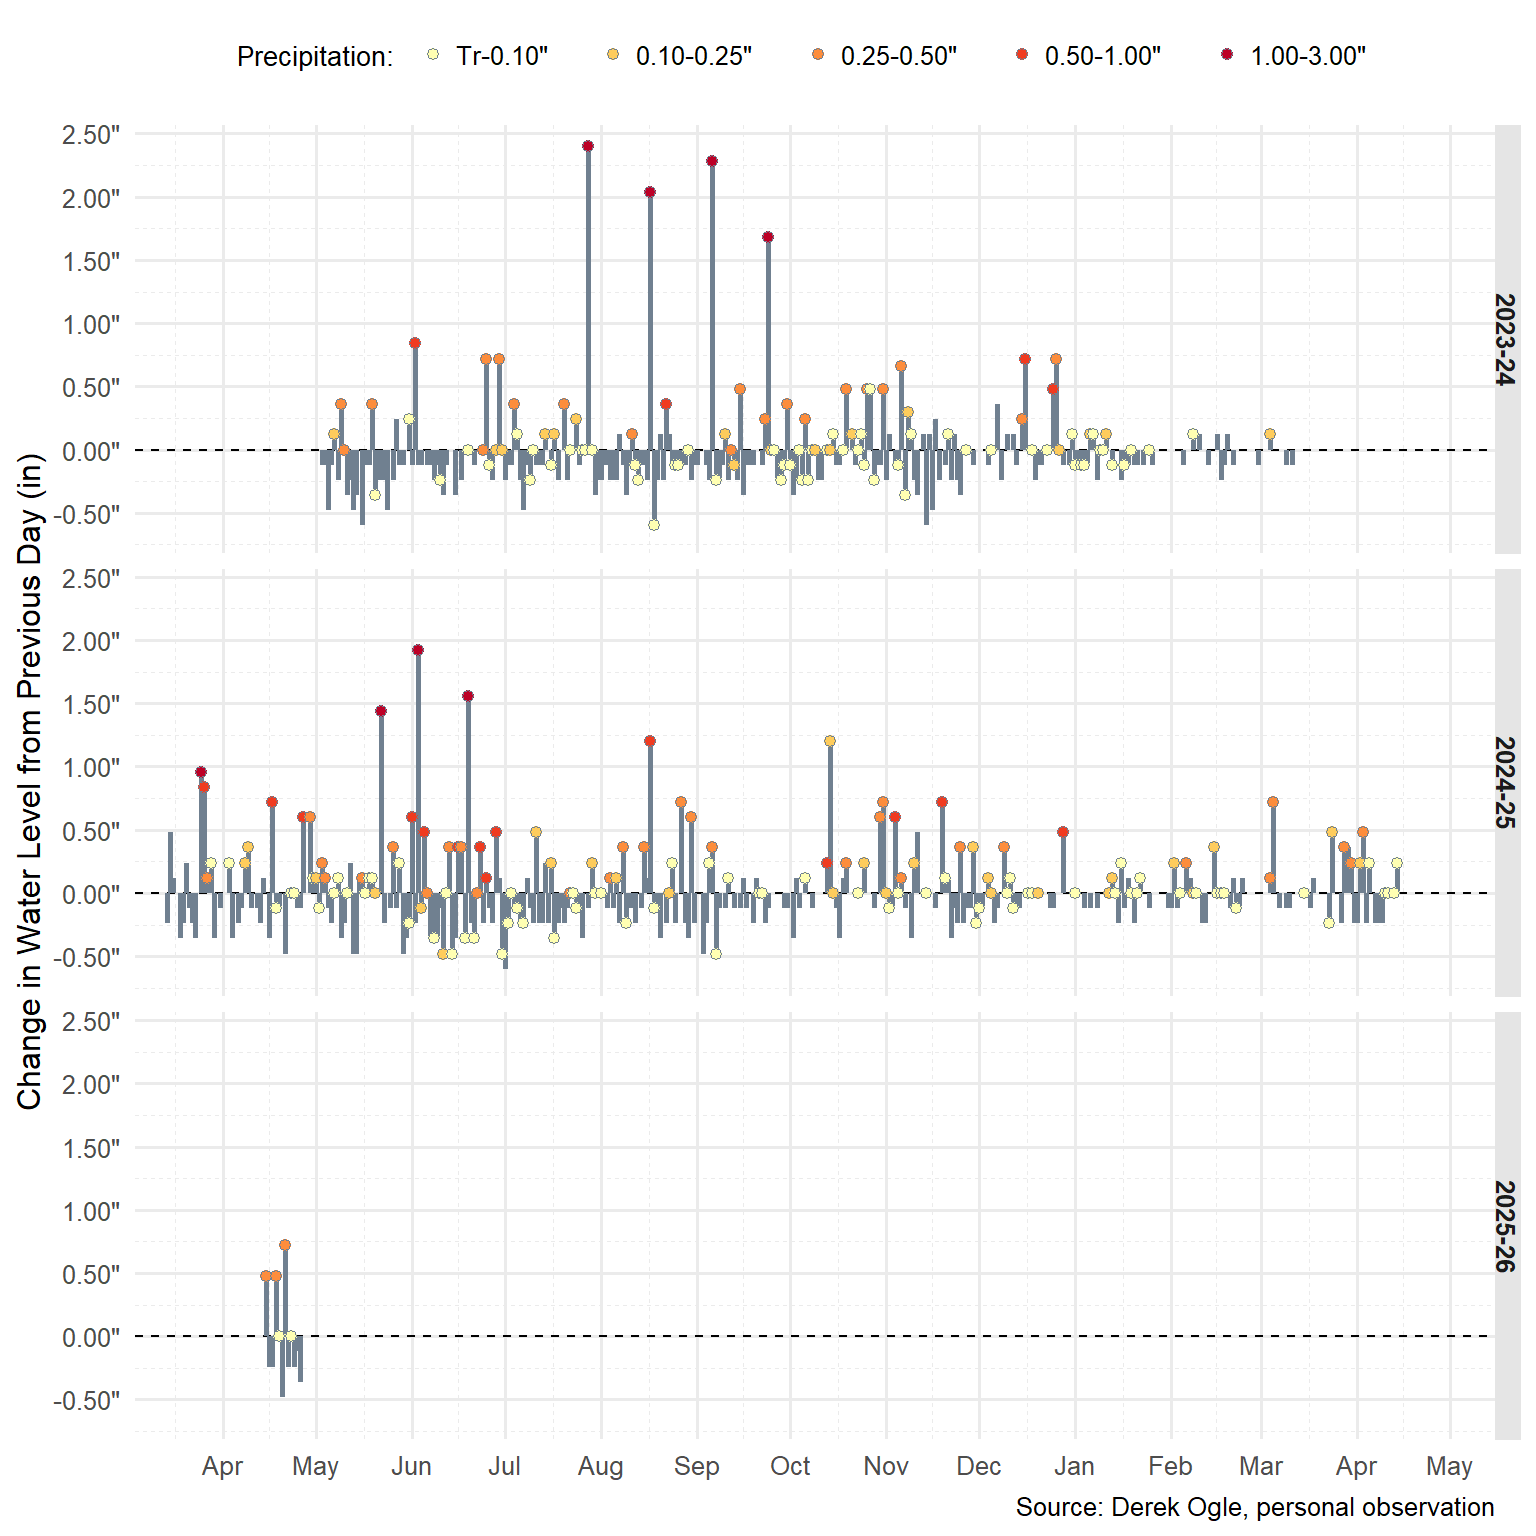
As seen in Figure 1 and Table 1, there can be considerable day-to-day variability in water level at the Flynn dam. Of course, the large increases are due to precipitation and the extended periods of decline in water level are due to lack of precipitation. Here are some preliminary thoughts about the daily changes in water level.
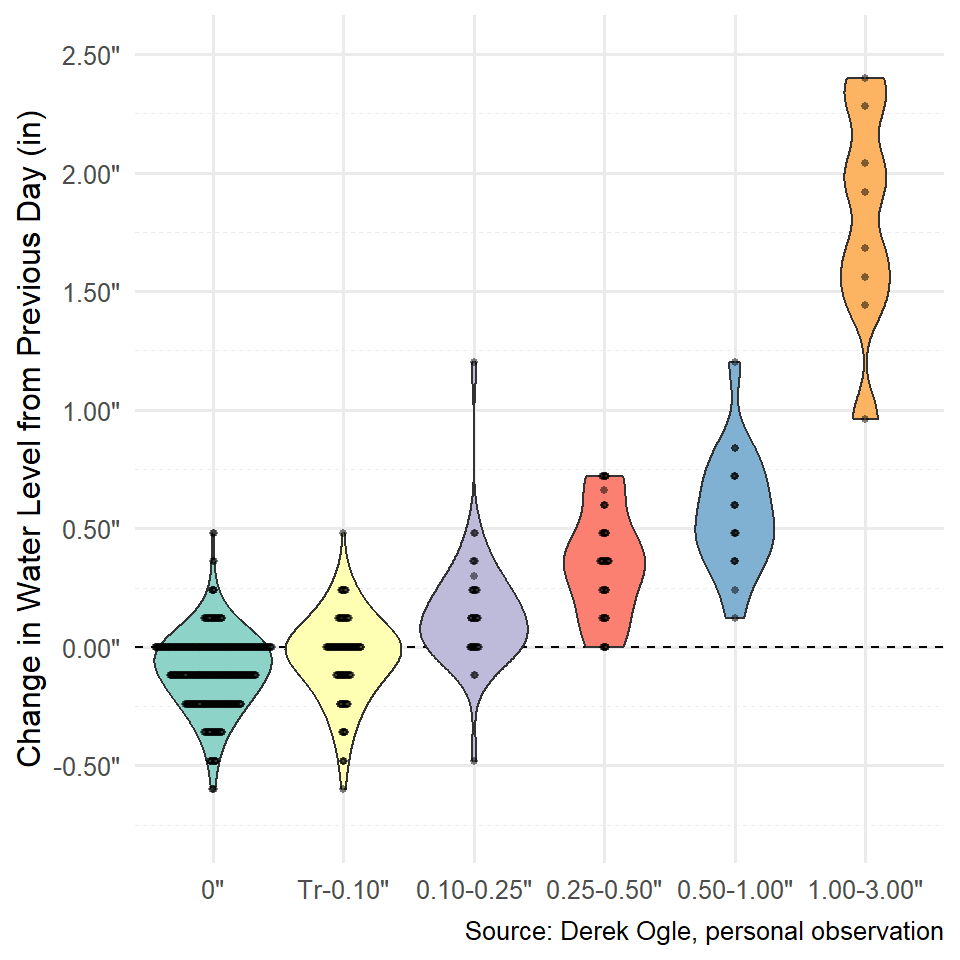
- The greatest daily change in water level was an increase of 2.5 on April 23, 2026 following 1.89” of rain. Interestingly lower daily water level increases were observed following greater amounts of rain on other dates (Figure 3).
- It appears that, without any additional precipitation, lake water levels generally drop about 1/8” to 1/4” per day (Figure 4; Figure 5) until a baseline level between 21” and 22” is approached (Figure 1; Figure 3). Near that baseline the drop in lake water level tends to be less.
- Lake water levels can increase substantially with precipitation (Figure 5) but the actual rise does not always match the amount of precipitation, sometimes being more and sometimes being less than the precipitation amount (Figure 3; Figure 4).
Data Collection
Data collection is pretty straightforward for this project. I, or a friend, record the water level at the gauge to the nearest 0.01’ each day (as possible) as close to noon as possible. On the few days where we could not make the reading, I linearly interpolated the water level from the two adjacent readings. Surprisingly, it is harder to read the gauge then you would imagine. On a few days, we had multiple people read the gauge and from this I expect the “human error” of the readings to be about 0.01’.
The lake water level readings should be considered as “relative” values as it is not clear to me what the gauge is measuring from. In other words, a reading of 21” is not meaningful in and of itself (i.e. 21” from what?), but it does have meaning relative to another measurement of, say, 24” (i.e., it is 3” lower).
Precipitation measurements are from my data recorded for the CoCoRaHS Network at a location near the shore of Eagle Lake, the next lake upstream from Flynn Lake. Snow was converted to a “snow water equivalent” (SWE) to most closely compare with rain. Ice out was for Eagle Lake as recorded by Gary Hagstrom (see this).
Acknowledgments
Thanks to Hal A, Ieuan A, Joe R., Kevin S., Sjana S, and Tim T. for taking the measurements when I could not!!
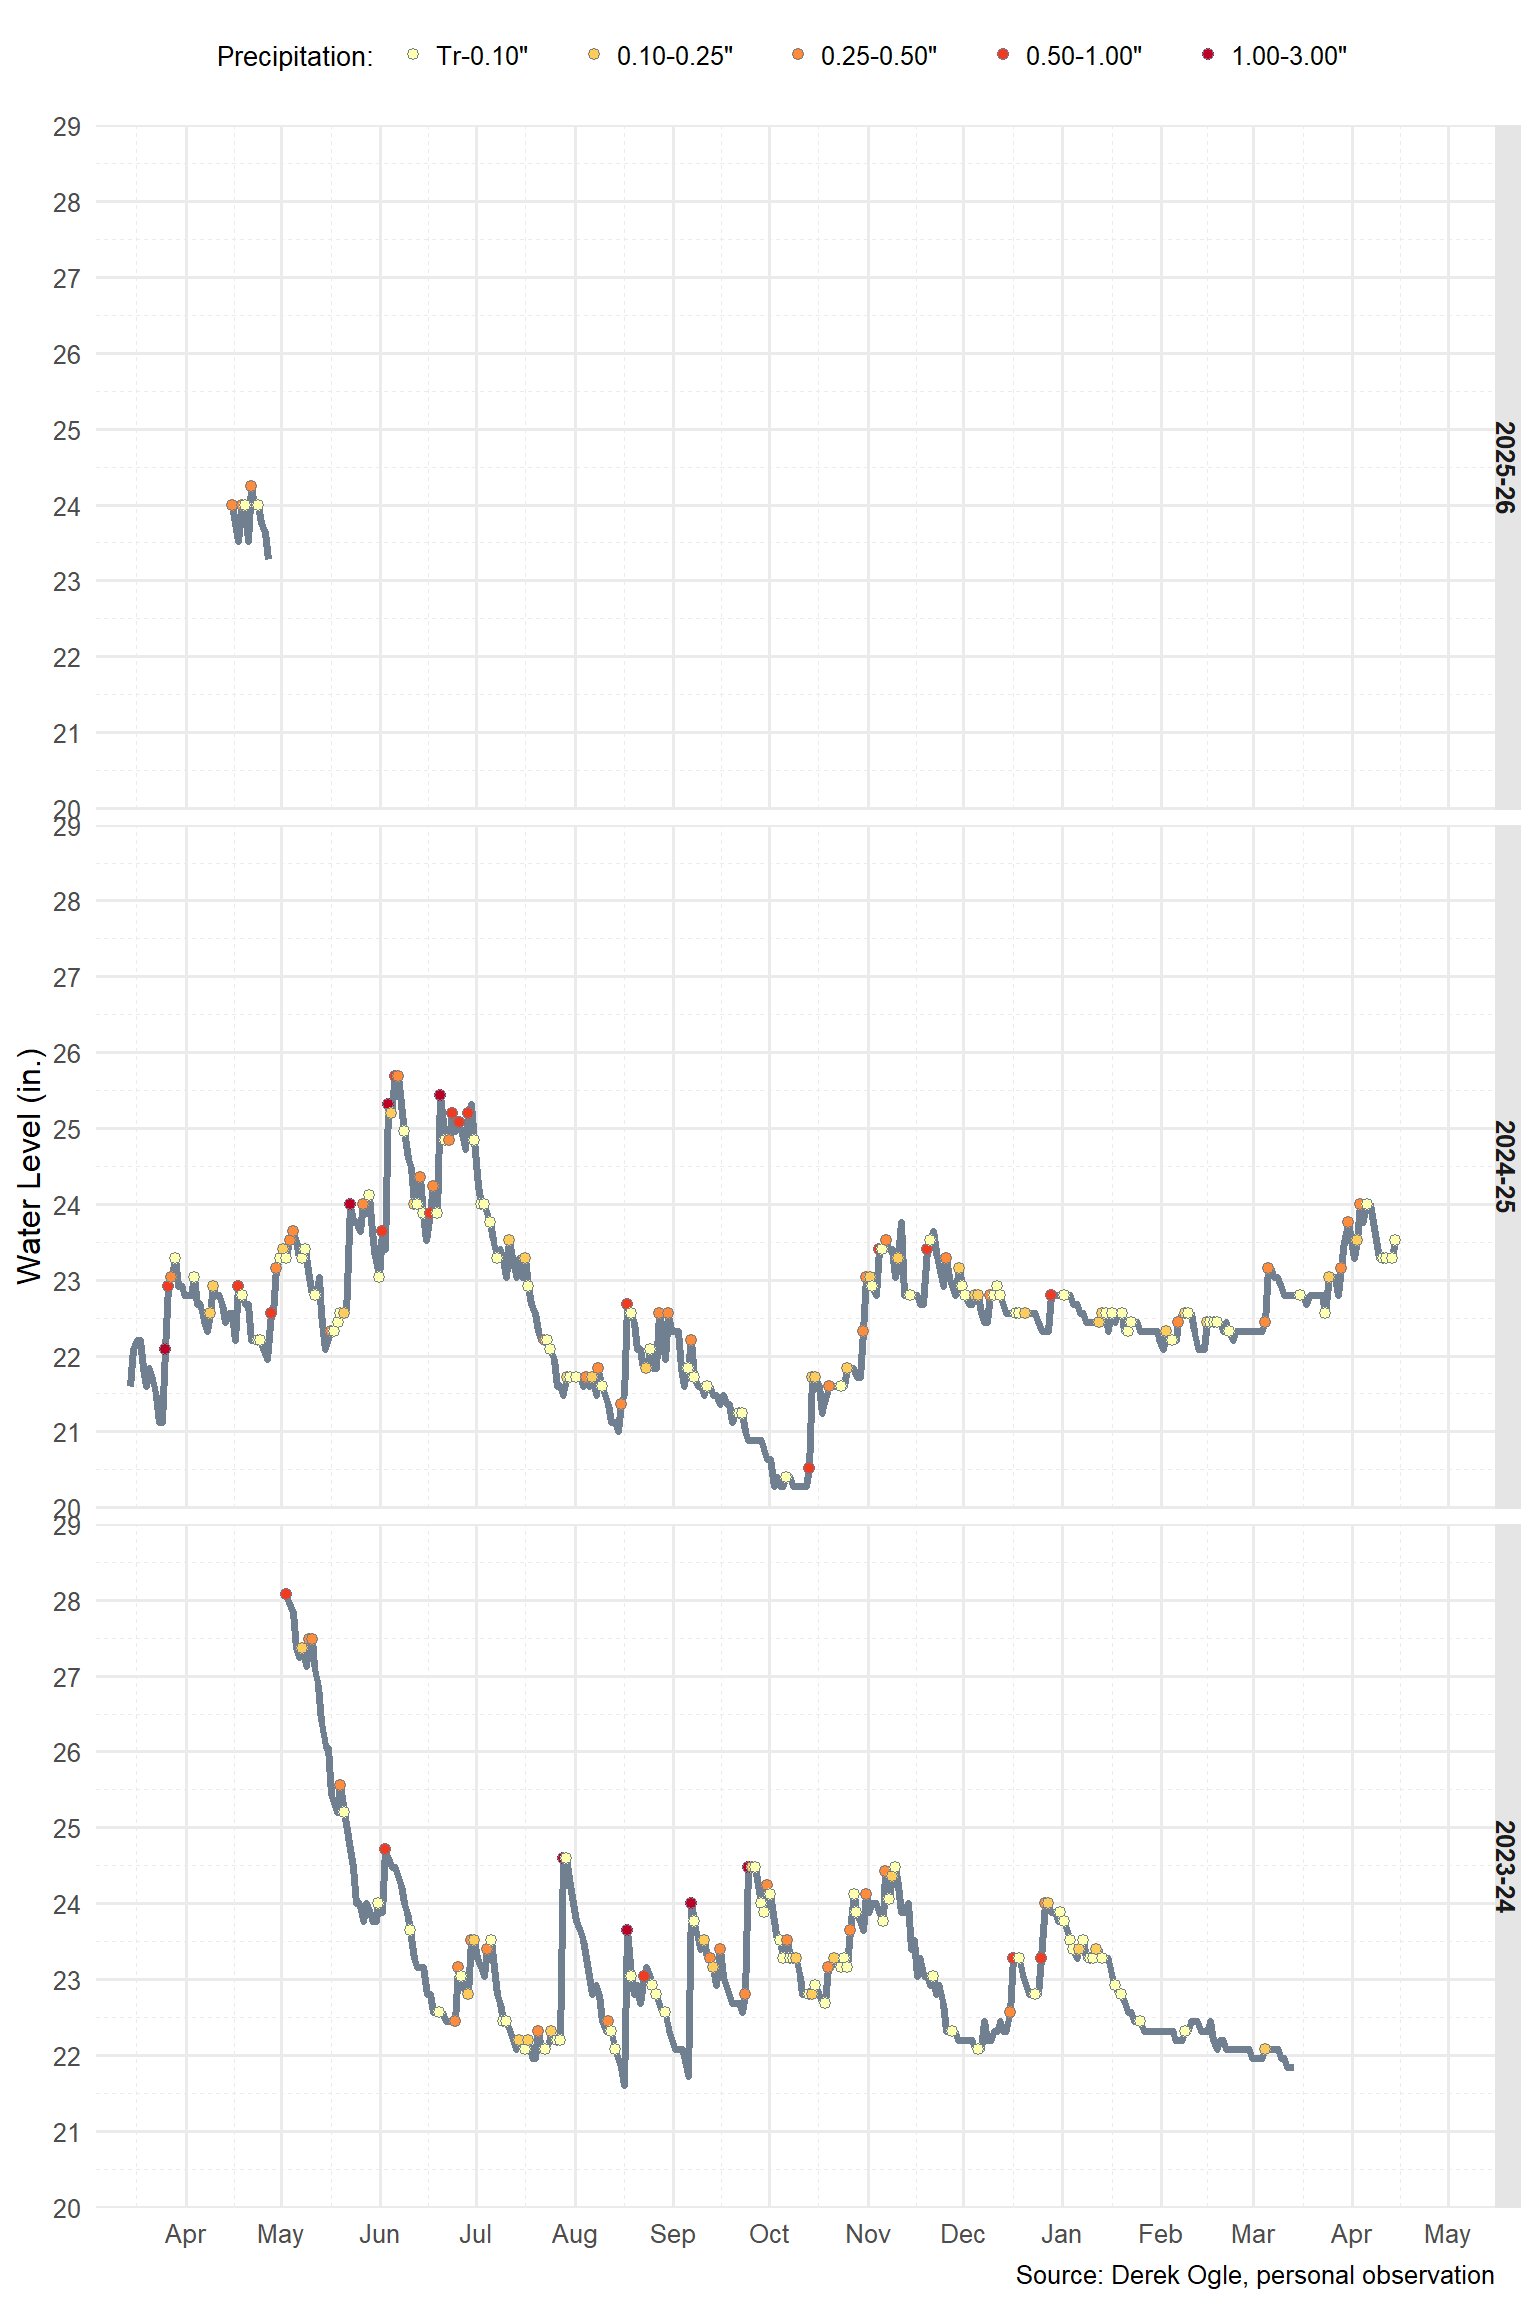
Appendix
The graph below shows the daily water level at the gauge for each ice-out to ice-out season with points color coded by the amount of precipitation for days where precipitation occurred (no point is shown for days without precipitation).