
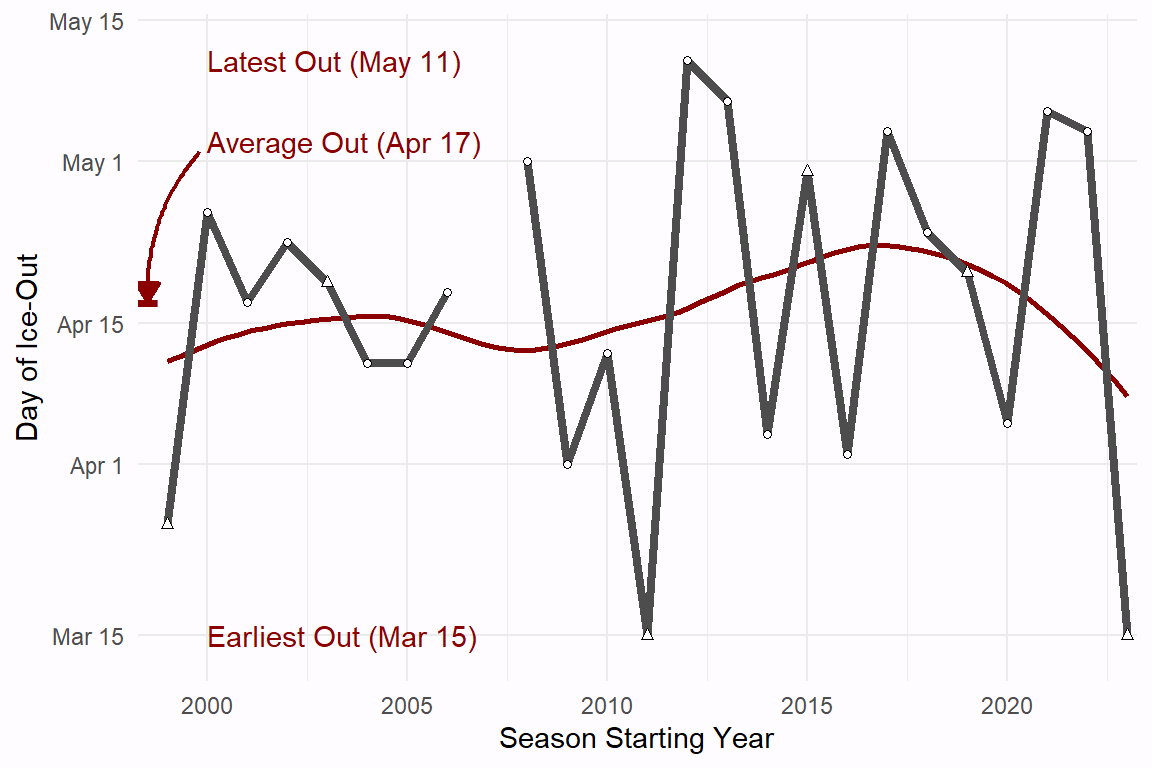
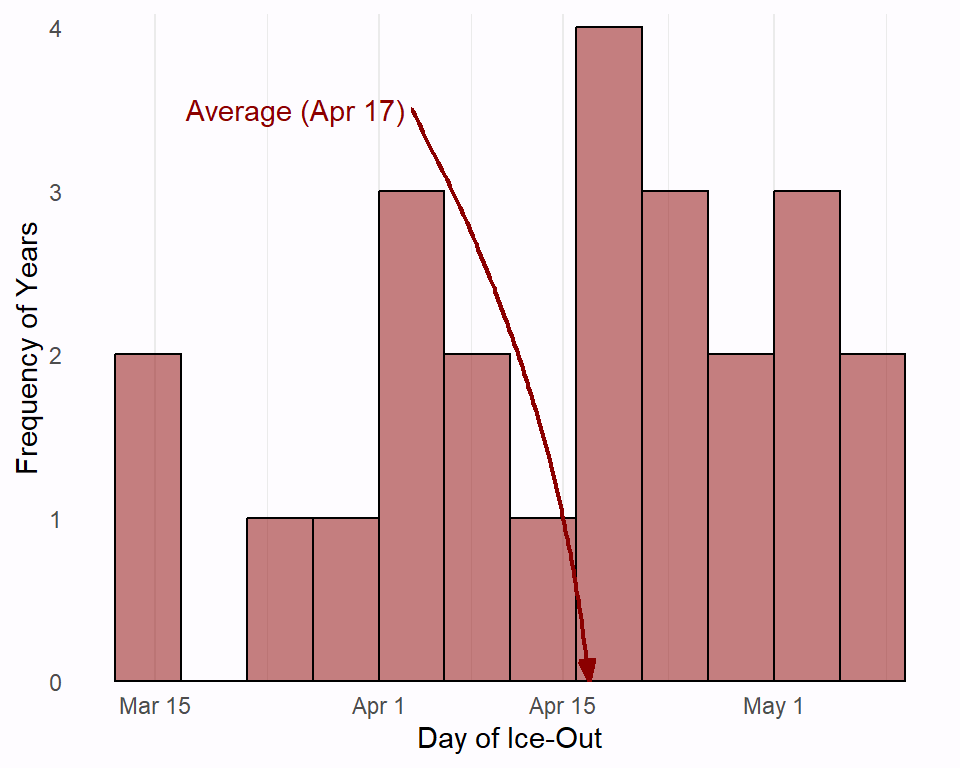
Ice-Out Dates
Comparison to Other Lakes
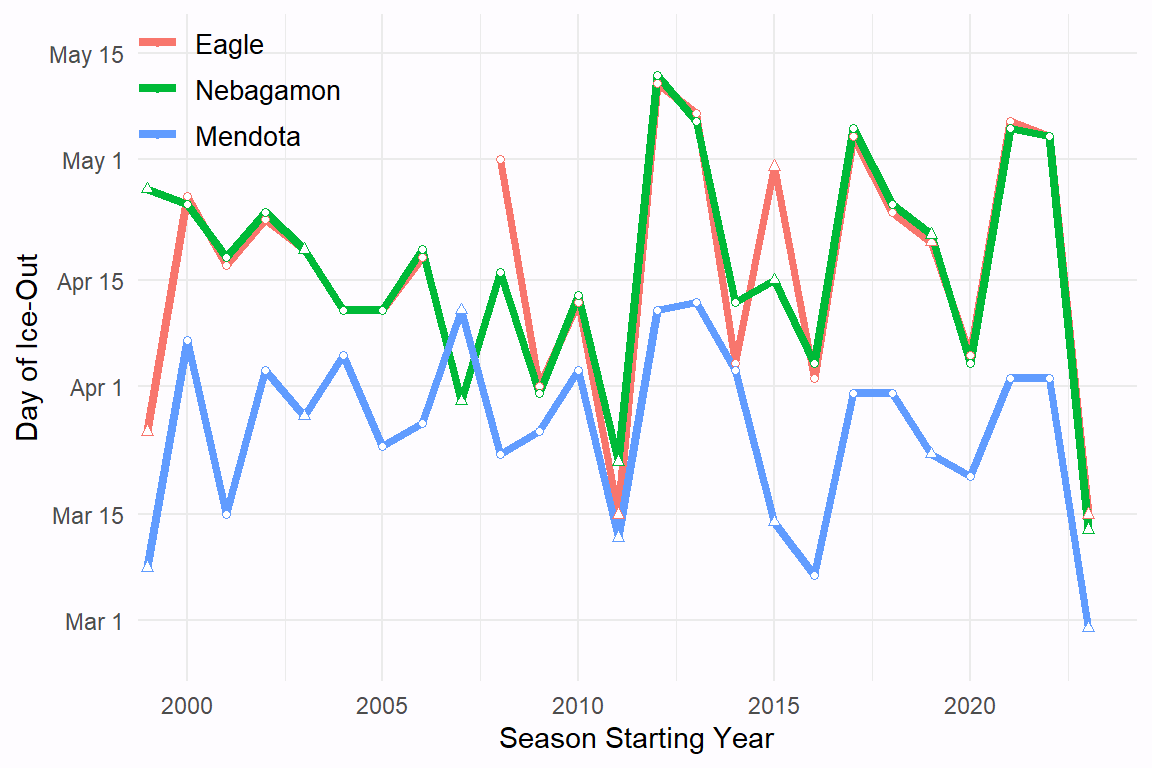
Lake Nebagamon is much larger (986 acres) but with a similar maximum depth (56 ft) as Eagle Lake that is approximately 20 miles nearly straight west of Eagle Lake. With the exception of a few notable years, the ice-out dates between these two lakes are quite similar. Lake Mendota is a very large (9781 acres) and deep (83 ft maximum) lake that is approximately 350 miles south of Eagle Lake. The ice-out dates for Mendota are always before those for Eagle Lake, but they very generally track together.
Data Notes
These data were recorded by Gary Hagstrom. His general criterion was “complete ice out”; i.e., the lake completely devoid of ice with the exception of small remnants on north-facing shores.
Dates show above have been adjusted for leap years to maintain consistency across years. For example, Gary recorded ice out in 2024, a leap year, as 14-Mar but it appears as 15-Mar above to account for the extra “leap day” in Feb. In other words, 14-Mar is later in the year in a leap year then it is in a non leap year, which is accounted for above. Leap years are shown with triangles (rather than circles) in the time series graphs above.