Note:
- MSTotal is not usually shown in an ANOVA table but it is an important value (i.e., the overall variance ignoring the groups). I put it in the table for the second question because it was one of the given values.
- When you see a question about a “variance” then it will be answered with an “MS”. Questions about variance of individuals will NOT be MSAmong. Variances ignoring groups uses the simple model and will thus be MSTotal.
- In the cuckoos question …
- Don’t say “the groups differ” or the “the mean differs among groups.” Be explicit … say “the mean length of cuckoo eggs differs among the three host species nests.”
ANOVA Table Completion I
| Source | df | SS | MS | F | p-value |
|---|---|---|---|---|---|
| Among | 3 | 17.25 | 5.75 | 1.26 | 0.315 |
| Within | 20 | 91.20 | 4.56 | - | - |
| Total | 23 | 108.45 | - | - | - |
- See completed table above. Note the following
- MSamong is from multiplying F and MSwithin.
- dfamong is then SSamong divided by MSamong.
- dfwithin is then dftotal-dfamong.
- SSwithin is then MSwithin times dfwithin.
- SStotal is then SSamong + SSwithin.
- The p-value is from
distrib(1.26,distrib="f",df1=3,df2=20,lower.tail=FALSE).
- The number of groups = 3+1 = 4 (i.e., $dfamong+1).
- The number of individuals = 23+1 = 24 (i.e., $dftotal+1).
- The variability among individuals within groups is sp2 = $MSwithin = 4.56.
- The variabilty among individuals ignoring groups is s>sup>2 = MStotal = \(\frac{108.45}{23}\) = 4.72.
- No, there is not a significant difference among the group means because the p-value is greater than 0.05.
ANOVA Table Completion II
| Source | df | SS | MS | F | p-value |
|---|---|---|---|---|---|
| Among | 5 | 887.05 | 177.41 | 5.25 | 0.001 |
| Within | 48 | 1621.44 | 33.78 | - | - |
| Total | 53 | 2508.49 | 47.33 | - | - |
- See completed table above. Note the following
- MStotal and MSwithin are given by definition (the variance of individuals ignoring groups is MStotal whereas the pooled (or combined) variance of individuals considering groups is MSwithin).
- The df are found by knowing the number of groups (I=6) and total number of individuals (n=54).
- SSwithin and SStotal are obtained with MS*df.
- SSamong is from SStotal}-SSwithin.
- MSamong is from SSamong divided by dfamong.
- F is from MSamong divided by dfamong.
- The p-value is computed with
distrib(5.25,distrib="f",df1=5,df2=48,lower.tail=FALSE).
- Yes, there is a difference among the group means because the p-value is less than 0.05.
Raising Young Cuckoos
- The overall sample size is n=44 and the number of groups is I=3.
- Each degrees-of-freedom is calculated as shown below.
- dfspecies is dfAmong, which is one less than the number of groups (host bird species; I=3) in the analysis.
- dfResiduals} is dfWithin, which is the total number of cuckoo eggs (n=44) minus the total number of groups (I=3) in the analysis.
- dfTotal is not shown from
anova()but it is the total number of cuckoo eggs (n=44) minus 1.
- Interpretations of the mean-squares are below.
- MSspecies is MSAmong, which is the variability that is explained by using separate means (full model) that was not explained when only one mean (simple model) was used to represent all three groups. It is also the variability of the group means.
- MSResiduals is MSWithin, which is the variability in cuckoo egg length around the mean cuckoo egg length of each host bird species group or the variability unexplained by using a separate mean for each group (i.e., the full model).
- MSTotal is not shown from
anova(), however it is the variability in cuckoo egg length around the grand mean or the variability unexplained by using only one mean (simple model) to represent all three groups.
- The F test statistic is the ratio of the variability explained by the full model that was not explained by the full model. Alternatively, the F test statistic is the ratio of the variance of group means to the variance of individuals within the groups. Alternatively, it is the reduction in lack-of-fit from using the full model to the lack-of-fit of the full model.
- The p-value (0.820) is greater than α thus, the simple model is adequate (compared to the full model), the H0 is not rejected, and it is concluded that there is no statistical difference in mean cuckoo length among the three species of host birds.
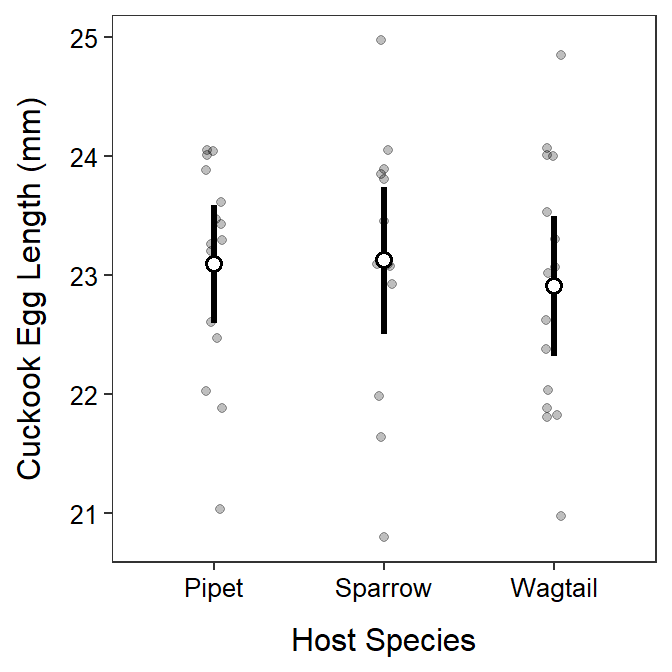
- The summary figure is below.
- There is no statistical difference in the mean length of cuckoo eggs among the three species of host birds. Thus, it does not appear that host species is related to egg length.
R Code and Results.
> cuc <- read.csv("Cuckoos.csv")lm1 <- lm(length~species,data=cuc)
anova(lm1)Analysis of Variance Table
Response: length
Df Sum Sq Mean Sq F value Pr(>F)
species 2 0.410 0.20496 0.1992 0.8202
Residuals 41 42.182 1.02883 ggplot(data=cuc,mapping=aes(x=species,y=length)) +
geom_jitter(alpha=0.25,width=0.05) +
stat_summary(fun.data=mean_cl_normal,geom="pointrange",
size=1.1,fatten=2,pch=21,fill="white") +
labs(y="Cuckook Egg Length (mm)",x="Host Species") +
theme_NCStats()