Note:
- Make sure you show an “R Code and Results” section.
- Use complete sentences to answer questions.
- I usually round summary statistics to one more decimal place than the way the data were recorded. In this case pH was recorded to two decimals so I used three decimals for my means. I usually use three or four decimals for the test statistics and p-values.
- Make sure to define all symbols in your hypotheses.
- Note the explanation for “independence” in the assumption checking. It is not adequate to just say “there is no connection”; you need to explain why you think there is no connection.
- When checking equal variances you must explicitly refer to the Levene’s test results.
- The appropriate statistic is the DIFFERENCE in means, not just the two means.
- When interpreting the rejection decision and the confidence intervals make sure you use “MEAN ph” and not “the pH”. Hypotheses and confidence intervals are about summaries, not individual values.
- When making a conclusion make sure you say what is different … say “mean Ph differs between stream A and stream B” not “the group means differ.” Don’t just say “the null hypothesis is rejected” … explain what that means about mean pH.
- When interpreting the confidence interval after rejecting H0 make sure to explicitly say which group is larger (or smaller) and by how much.
pH in Two Rivers
- H0: μA=μB and H0: μA≠μB, where μ is the population mean pH, A is stream A, and B is stream B.
- Assumption checking:
- Independence: The pH measurements across streams are likely independent of each other because the two streams were said to be in different watersheds with different geologies. It is possible that the measurements were recorded on the same days which could lead to a dependence. As there is no evidence for this I will assume that this assumption is met.
- Normality: The questions says to assume that the distributions are normal.
- Equal variances: The population variances appear equal because Levene’s test p-value (0.3745) is greater than α=0.05.
- Independence: The pH measurements across streams are likely independent of each other because the two streams were said to be in different watersheds with different geologies. It is possible that the measurements were recorded on the same days which could lead to a dependence. As there is no evidence for this I will assume that this assumption is met.
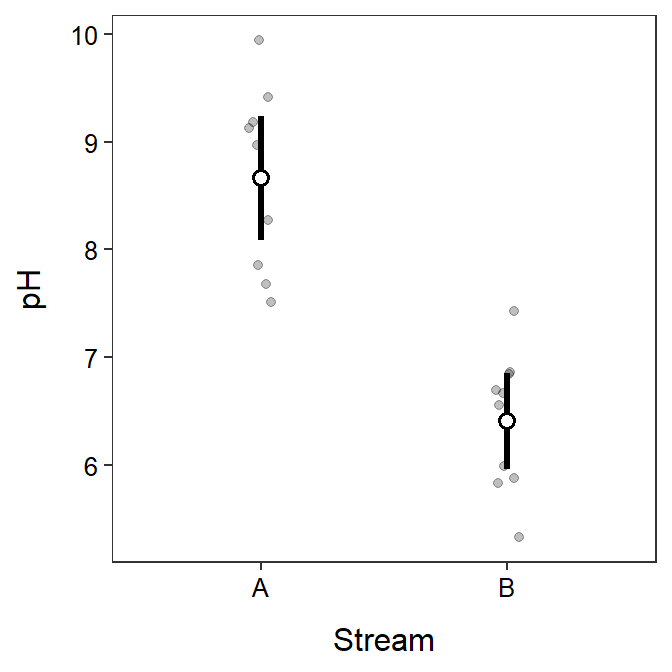
- The appropriate statistic is 8.662-6.408=2.254.
- The appropriate test statistic is 6.985 with 18 df.
- The p-value is <0.00005 (or more specifically 1.599e-06).
- This p-value is less than α=0.05, which means that H0 is rejected and it appears that the mean pH is greater for stream A than for stream B.
- It appears that the mean pH for stream A is between 1.576 and 2.932 greater than the mean pH for stream B.
- The graphic is shown in the R Code and Results section below.
- It appears that the “signal” (difference in means) is greater than the “noise” (sampling variability) because the p-value is much less than α.
R Code and Results
> d <- read.csv("phLevels.csv")> levenesTest(pH~river,data=d)Levene's Test for Homogeneity of Variance (center = median)
Df F value Pr(>F)
group 1 0.8292 0.3745
18 > t.test(pH~river,data=d,var.equal=TRUE) Two Sample t-test with pH by river
t = 6.9849, df = 18, p-value = 1.599e-06
alternative hypothesis: true difference in means between group A and group B is not equal to 0
95 percent confidence interval:
1.576042 2.931958
sample estimates:
mean in group A mean in group B
8.662 6.408 > ggplot(data=d,mapping=aes(x=river,y=pH)) +
geom_jitter(alpha=0.25,width=0.05) +
stat_summary(fun.data=mean_cl_normal,geom="pointrange",
size=1.1,fatten=2,pch=21,fill="white") +
labs(y="pH",x="Stream") +
theme_NCStats()