Note:
- Use complete sentences to answer questions.
Male-Female Birth Ratio
- The equation of the best-fit line is PropMale=0.620-0.000054Year.
- The slope means that for every increase of one year that the proportion of males decreases by between 0.000035 and 0.000074, on average.
- The intercept means that in theoretical year 0 the proportion of males was between 0.581158 and 0.659013, on average. This obviously does not make sense as year 0 is an extreme extrapolation.
- The r2 means that 63.7 of the variability in the proportion of males is explained by knowing the year of the sample.
- The predicted proportion of males in 1990 is 0.5169.
- The predicted proportion of males in 2020 is 0.5104. This value should be interpreted cautiously as it is an extrapolation (there is no reason to believe that the line will extend out to 2020).
- The residual for 1980 is 0.0003 (=0.5129-0.5126).
- The best-fit line is shown in the plot below.
R Code and Results.
> br <- read.csv("BirthRatio.csv")lm.br <- lm(propmale~year,data=br)
cbind(Est=coef(lm.br),confint(lm.br)) Est 2.5 % 97.5 %
(Intercept) 6.200857e-01 5.811580e-01 6.590134e-01
year -5.428571e-05 -7.394606e-05 -3.462537e-05rSquared(lm.br)[1] 0.6373997ggplot(data=br,mapping=aes(x=year,y=propmale)) +
geom_point(pch=21,color="black",fill="lightgray") +
labs(x="Year",y="Proportion of Births that were Male") +
theme_NCStats() +
geom_smooth(method="lm",se=FALSE)`geom_smooth()` using formula 'y ~ x'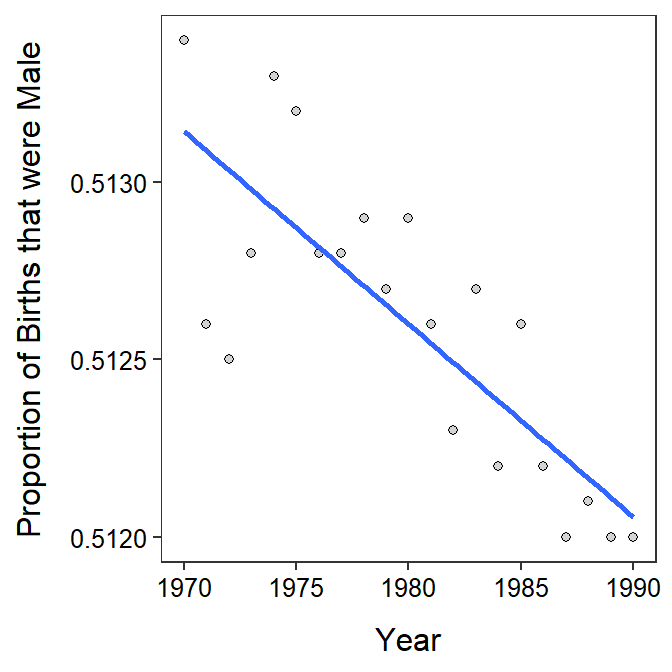
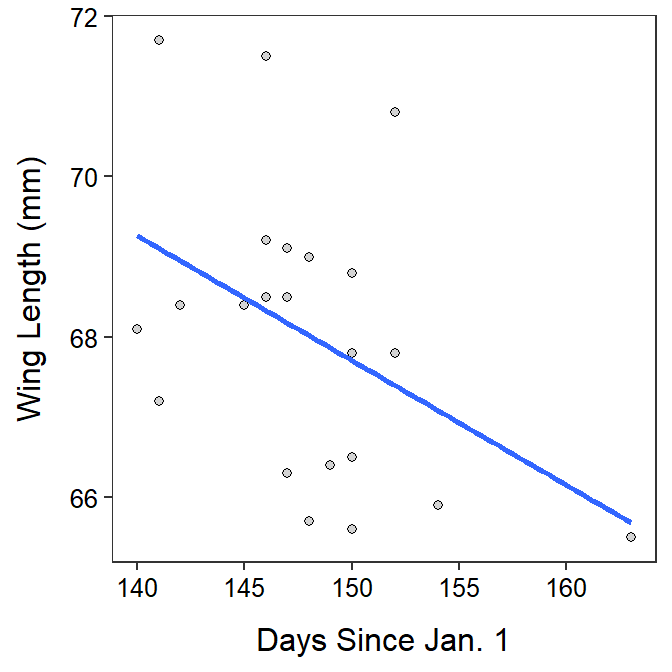
Willow Flycatcher Migration
- The equation of the best-fit line is WingLength=91.070-0.155761Days.
- The slope means that for every increase of one day that the wing length decreases by between 0.004 and 0.307 mm, on average.
- The intercept means that on January 1 (i.e., Day=0) was between 68.6 and 113.5 mm, on average. This could make sense as January 1 is a reasonable day, but it is an extrapolation of approximately 140 days so it is unlikely a realistic estimate.
- The r2 means that 18.7 of the variability in wing length is explained by knowing the day of migration.
- The predicted wing length on day 160 is 66.1 mm.
- The residual for day 149 is -1.5 (=66.4-67.9) mm.
- The predicted wing length on day 140 is 69.3 mm. This value is not an extrapolation so this is a valid prediction.
- The best-fit line is shown in the plot below.
R Code and Results.
wfc <- read.csv("https://raw.githubusercontent.com/droglenc/NCData/master/Flycatcher.csv")
lm.wfc <- lm(winglen~date,data=wfc)
cbind(Est=coef(lm.wfc),confint(lm.wfc))
Est 2.5 % 97.5 %
(Intercept) 91.0702393 68.6497096 113.490769073
date -0.1557607 -0.3072602 -0.004261186rSquared(lm.wfc)[1] 0.186974ggplot(data=wfc,mapping=aes(x=date,y=winglen)) +
geom_point(pch=21,color="black",fill="lightgray") +
labs(x="Days Since Jan. 1",y="Wing Length (mm)") +
theme_NCStats() +
geom_smooth(method="lm",se=FALSE)`geom_smooth()` using formula 'y ~ x'