As part of the assignment template, the following two lines were run before the code run in the sections below.
> library(NCStats)
> library(ggplot2)
Note:
- Be careful with your “coding” – you need a space after your hashtags, you need a blank line before you start a numbered list, and you should not alter the first 20 or so lines of the template.
Mean and SD
- The mean is 10.
- The standard deviation is 4.10.
R Code and Results
> nums <- c(7,9,4,12,15,13)
> mean(nums)
[1] 10> sd(nums)[1] 4.09878p-Value
- The p=value is 0.000038
- This p-value is clearly less than α, so the H0 should be rejected.
R Code and Results
> distrib(5.678,distrib="t",df=13,lower.tail=FALSE)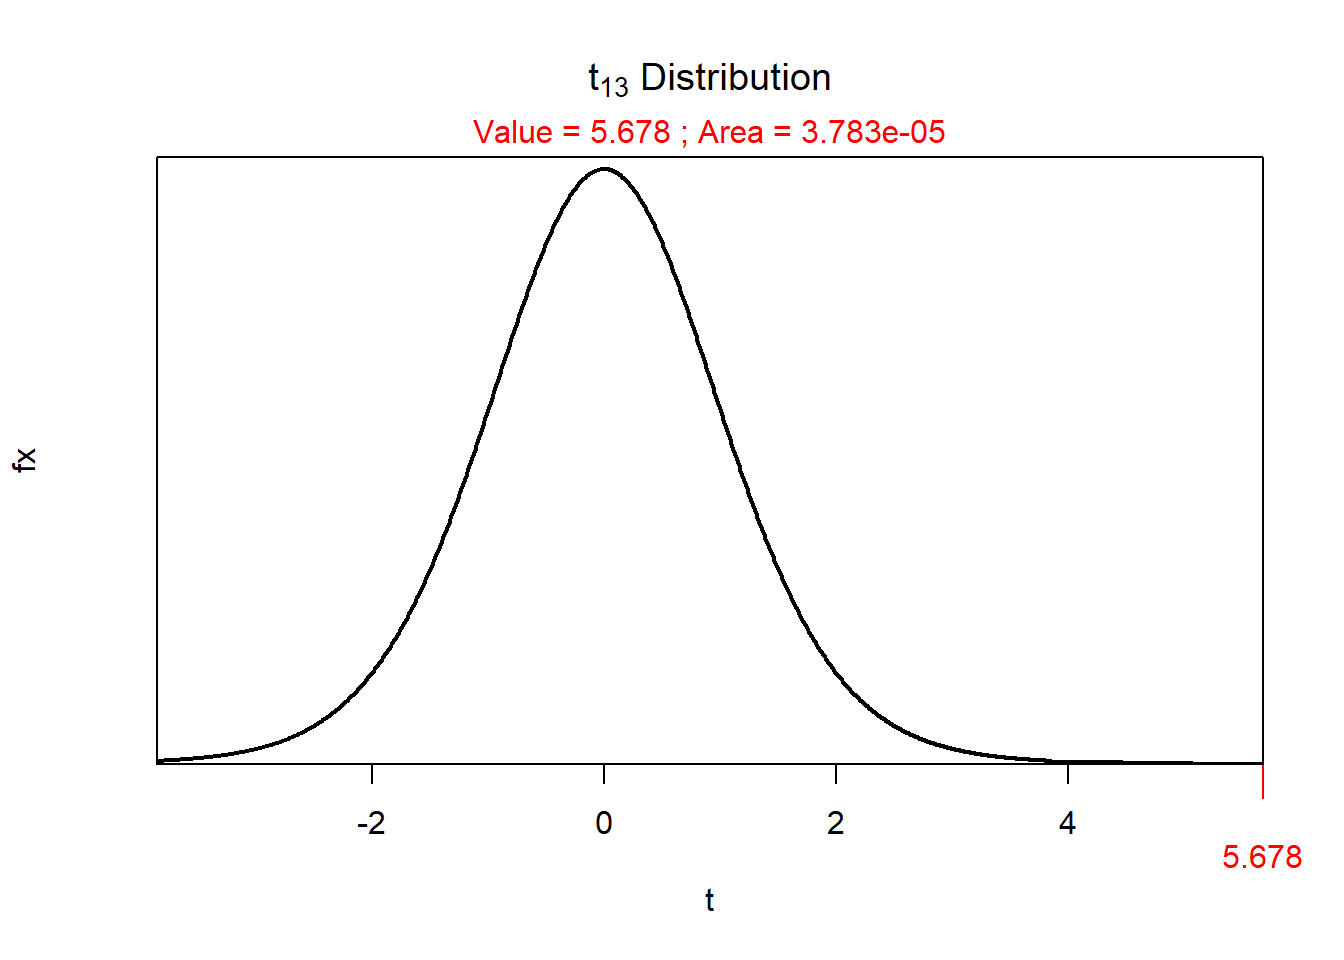
Types of Variability
Natural variability describes the fact that individuals in a population are not identical. Sampling variability describes the fact that results (e.g., mean) differ among multiple samples from the same population. The key difference is that natural variability is about individuals varying, whereas sampling variability is about statistics varying.