The Problem
I have been attempting to use RMarkdown rather than LaTeX to produce R examples. One issue that has slowed my conversion has been my struggles with how to reference figures and tables. The examples below illustrate how I have been using captioner to solve this problem.
The Solution
Foundation
For a simple example, I load FSAdata for the RuffeSLRH92 data, FSA for hist() and summarize(), and knitr for kable (to produce an RMarkdown table). Additionally, captioner is loaded.
library(FSAdata)
data(RuffeSLRH92)
library(FSA)
library(knitr)
library(captioner)
Separate captioner objects must be initialized for handling figures and tables. The prefix= argument sets the common prefix for all items of a certain type. Below, I initialize a function for creating captoins for figures and tables. The result of this code is two functions – one called figs that will hold a list of tags and captions for figures and another called tbls that will hold the same for tables.
figs <- captioner(prefix="Figure")
tbls <- captioner(prefix="Table")
These functions can be used to create on object that holds a tag, caption, and number for figures or tables, respectively. Initially, these functions are called with two arguments – the figure or table tag and the figure or table caption. For example, the code below creates tag and caption combinations for two figures. I prefer to create all tags and captions in one chunk (and use results='hide' to hide the immediate display of the information).
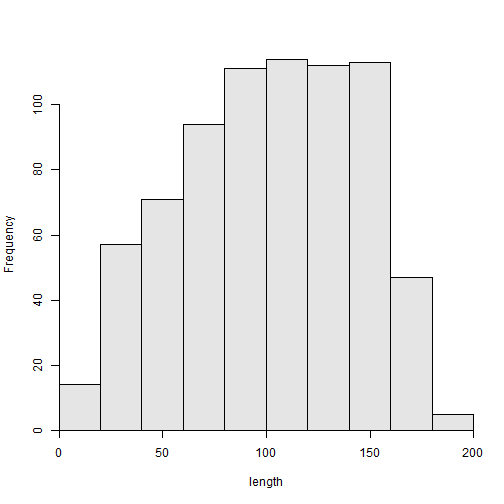
figs(name="LenFreq1","Length frequency of Ruffe captured in 1992.")
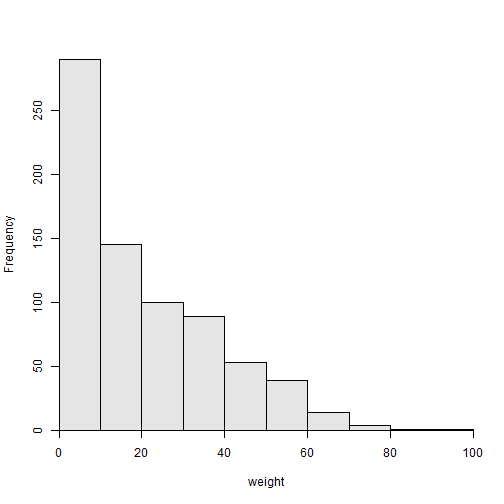
figs(name="WtFreq1","Weight frequency of Ruffe captured in 1992.")
The same function may then be used to retrieve the function name with a number, the figure number with a prefix, or the figure number.
figs("LenFreq1")## [1] "Figure 1: Length frequency of Ruffe captured in 1992."figs("LenFreq1",display="cite")## [1] "Figure 1"figs("LenFreq1",display="num")## [1] "1"The results returned by this function are exploited, as shown in the next section, to solve the figure referencing problem.
Application
The figs function may be used to add a figure caption to a figure. For example, the chunk below is followed by an inline R chunk of Figure 1: Length frequency of Ruffe captured in 1992..
hist(~length,data=RuffeSLRH92)
Figure 1: Length frequency of Ruffe captured in 1992.
In addition, use inline R code to refer to the figure. For example, figs("LenFreq1",display="cite") inside an inline R call would produce a reference to Figure 1.
As more functions are added, the figure numbers are incremented such that inline R code may refer to Figure 2 and Figure 1.
hist(~weight,data=RuffeSLRH92)
Figure 2: Weight frequency of Ruffe captured in 1992.
Tables can be handled in the same way. For example, see Table 1, which is related to Figure 1 and Figure 2.
tbls("SumLW1","Summary statistics of the length and weight of Ruffe captured in 1992.")sumLW <- rbind(Summarize(~length,data=RuffeSLRH92),
Summarize(~length,data=RuffeSLRH92))Table 2: Summary statistics of the length and weight of Ruffe captured in 1992.
##        n nvalid    mean       sd min Q1 median  Q3 max percZero
## [1,] 738    738 101.084 41.65587  13 70    103 135 192        0
## [2,] 738    738 101.084 41.65587  13 70    103 135 192        0