Background
A mathematics professor at Northland College has tracked the letter grade assigned to each student that completed a particular course for each of the last five academic years. The data can be found in MTHGrades.csv. The data are loaded below,1 and “W” (withdraw) and “I” (incomplete) grades were removed (use of filter()). The letter grades were ordered appropriately (using levels= in factor() in mutate()) and a second grade variable was created where “minus” and “plus” grades were converted to “whole” grades (use of mapvalues() in mutate()).2
#!# Set to your own working directory and have just your filename below.
grds <- read.csv("https://raw.githubusercontent.com/droglenc/NCData/master/MTHGrades.csv") %>%
  filter(!Grade %in% c("W","I")) %>%
  mutate(Grade2=plyr::mapvalues(Grade,from=c("A-","B+","B-","C+","C-","D+"),
                                to=c("A","B","B","C","C","D")),
         Grade2=factor(Grade2,levels=c("A","B","C","D","F")),
         Grade=factor(Grade,levels=c("A","A-","B+","B","B-","C+","C","C-","D+","D","F")))
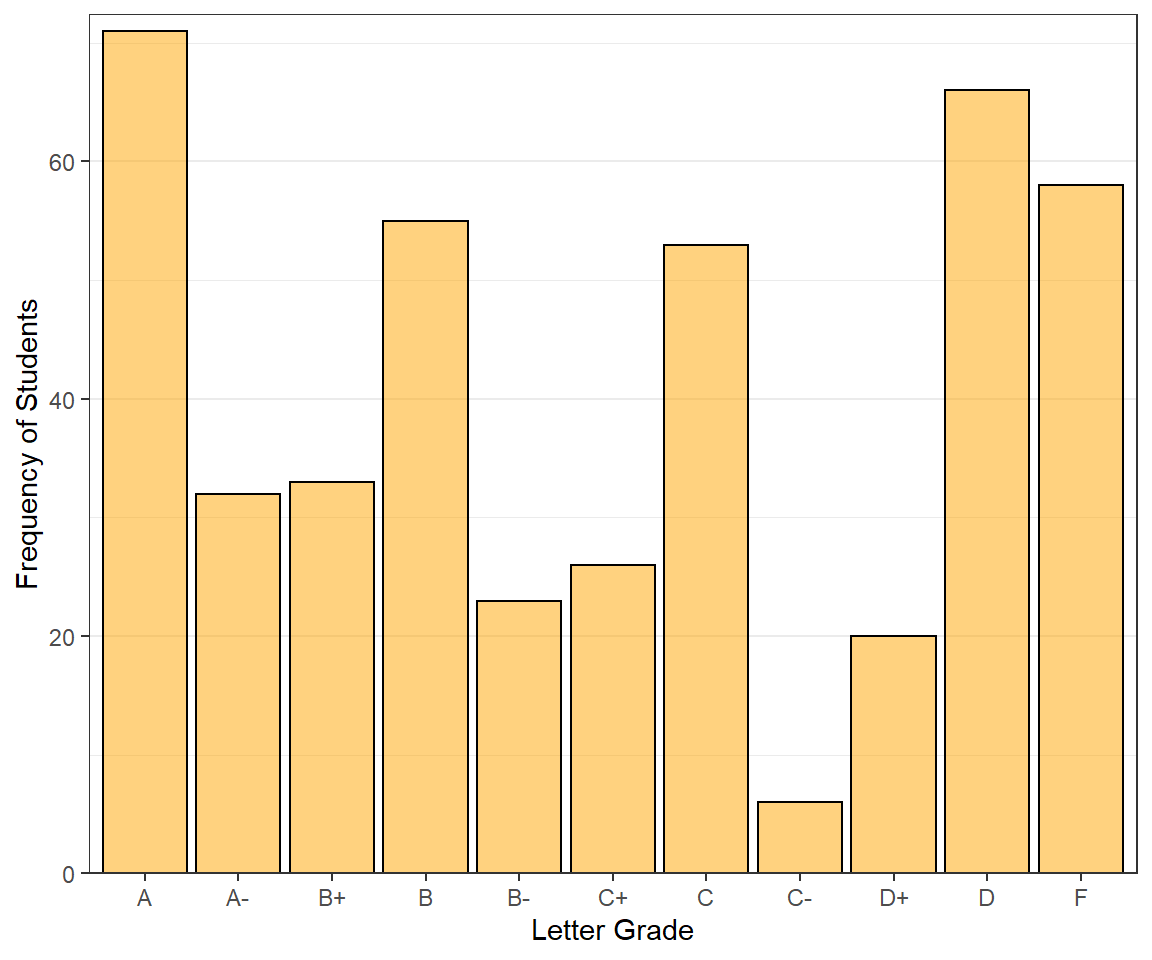
Example 1
Construct ggplot2 code to match the graph below (as closely as you can).
Example 2
Construct ggplot2 code to match the graph below (as closely as you can).
## `summarise()` has grouped output by 'AY'. You can override using the `.groups` argument.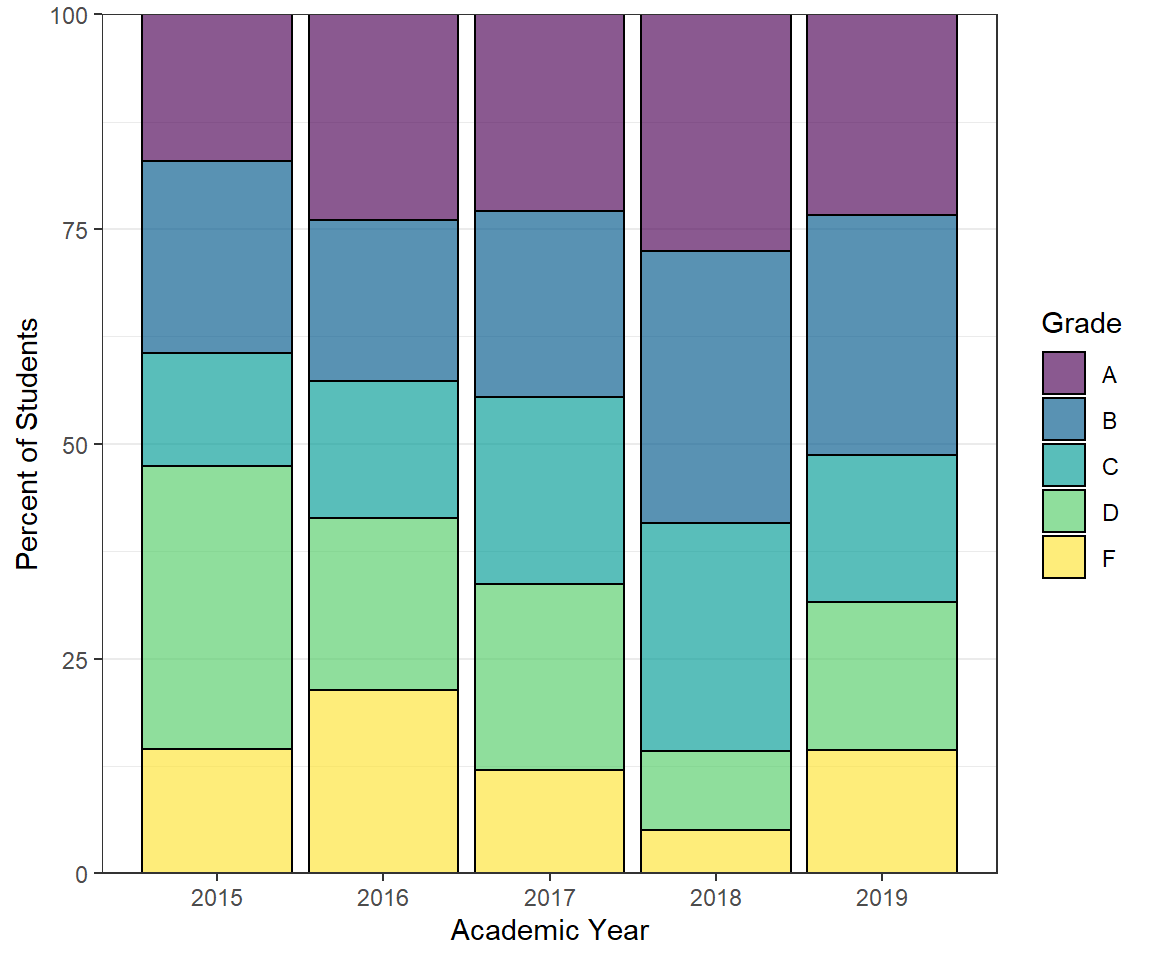
Footnote
These data were read directly from the webpage. However, the data can be downloaded to your computer and loaded from there into R, which would be similar to how you would load your own data into R. How to load a CSV file into RStudio is described in this video, for which the password is “NCStats” (without the quotes).↩︎
These code can be copied as is, but make sure to set your working directory with
setwd()and to put just the filename insideread.csv().↩︎