Background
This exercise uses the same harvest data for Whitetail Deer (Odocoileus virginianus) populations in Douglas, Bayfield, Ashland, and Iron Counties, the northern-most tier of couties in Wisconsin, from 2010-2019 used in this exercise. Load the data and create the same color palette used there.
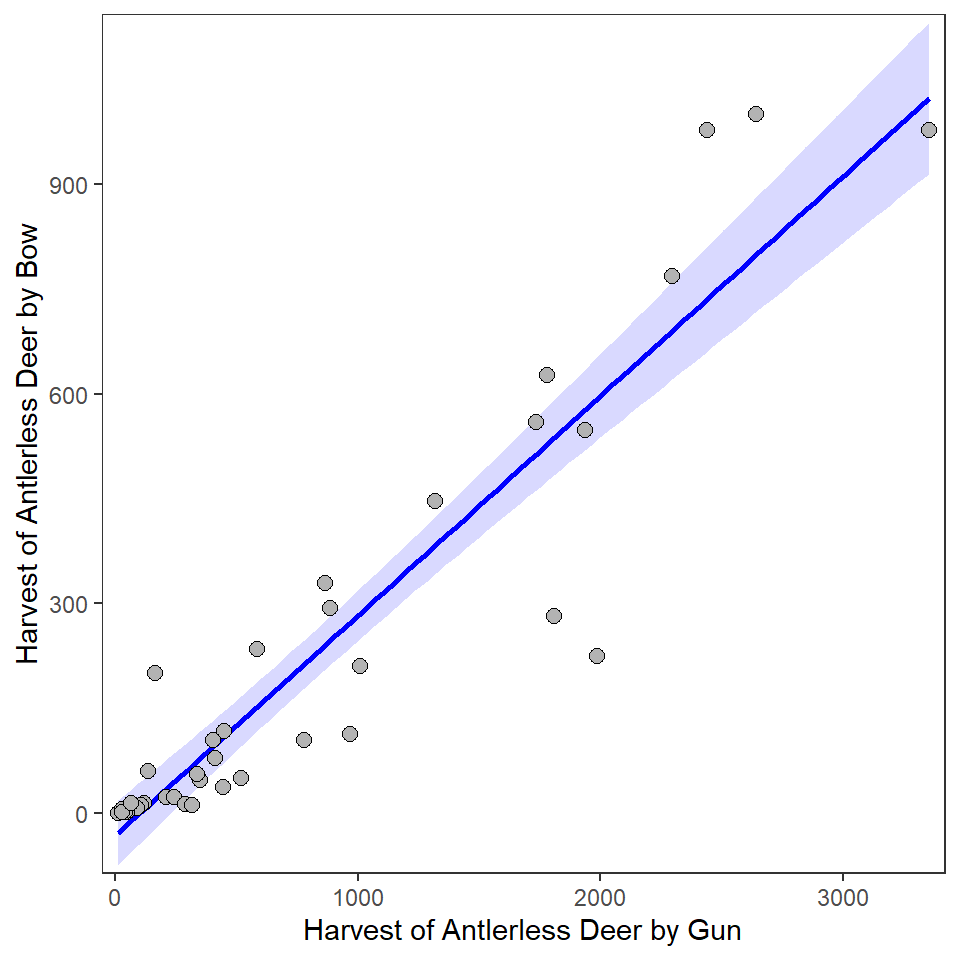
Antlerless Bow vs Gun Harvest 1
Construct ggplot2 code to match the graph below (as closely as you can).
Anlerless Bow vs Gun Harvest 2
Construct ggplot2 code to match the graph below (as closely as you can).
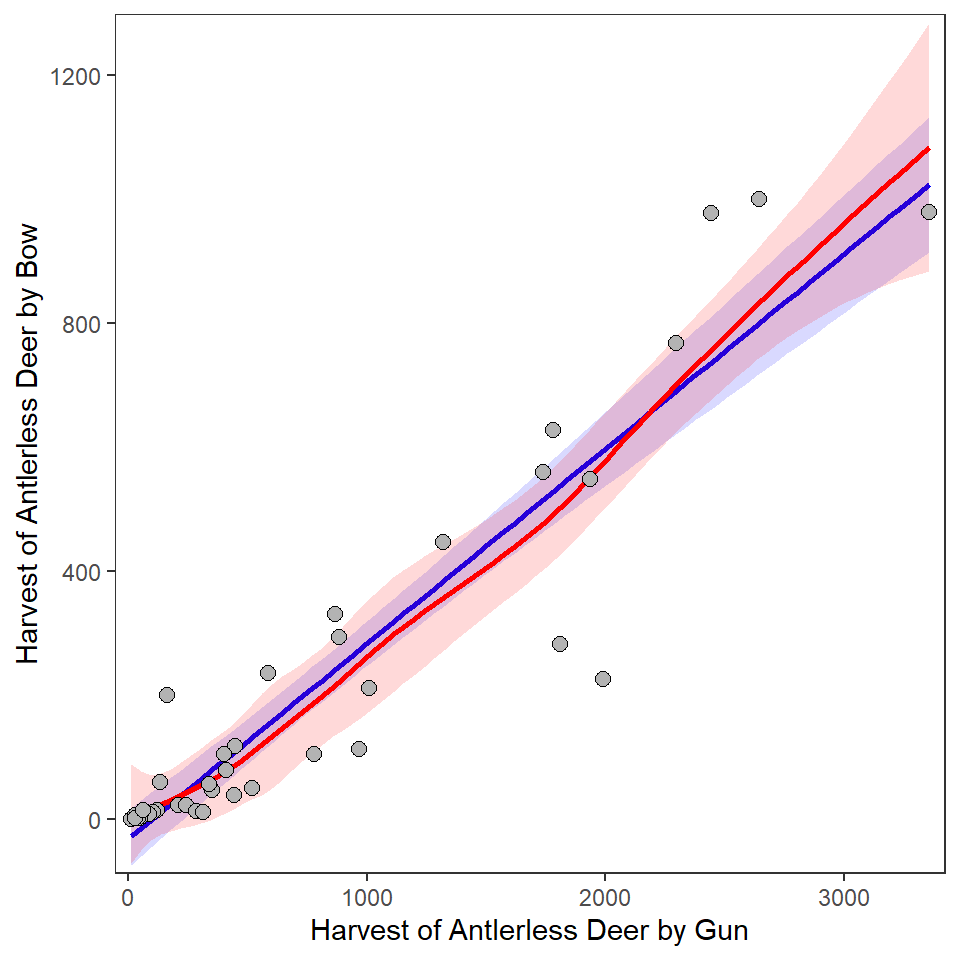
A regression model is much simpler to interpret than a LOESS model. Does it seem “worth it” to use the LOESS model to describe the relationship between antlerless deer harvested by bow and gun? Explain!
Antlerless Bow vs Gun Harvest by County 1
Construct ggplot2 code to match the graph below (as closely as you can).
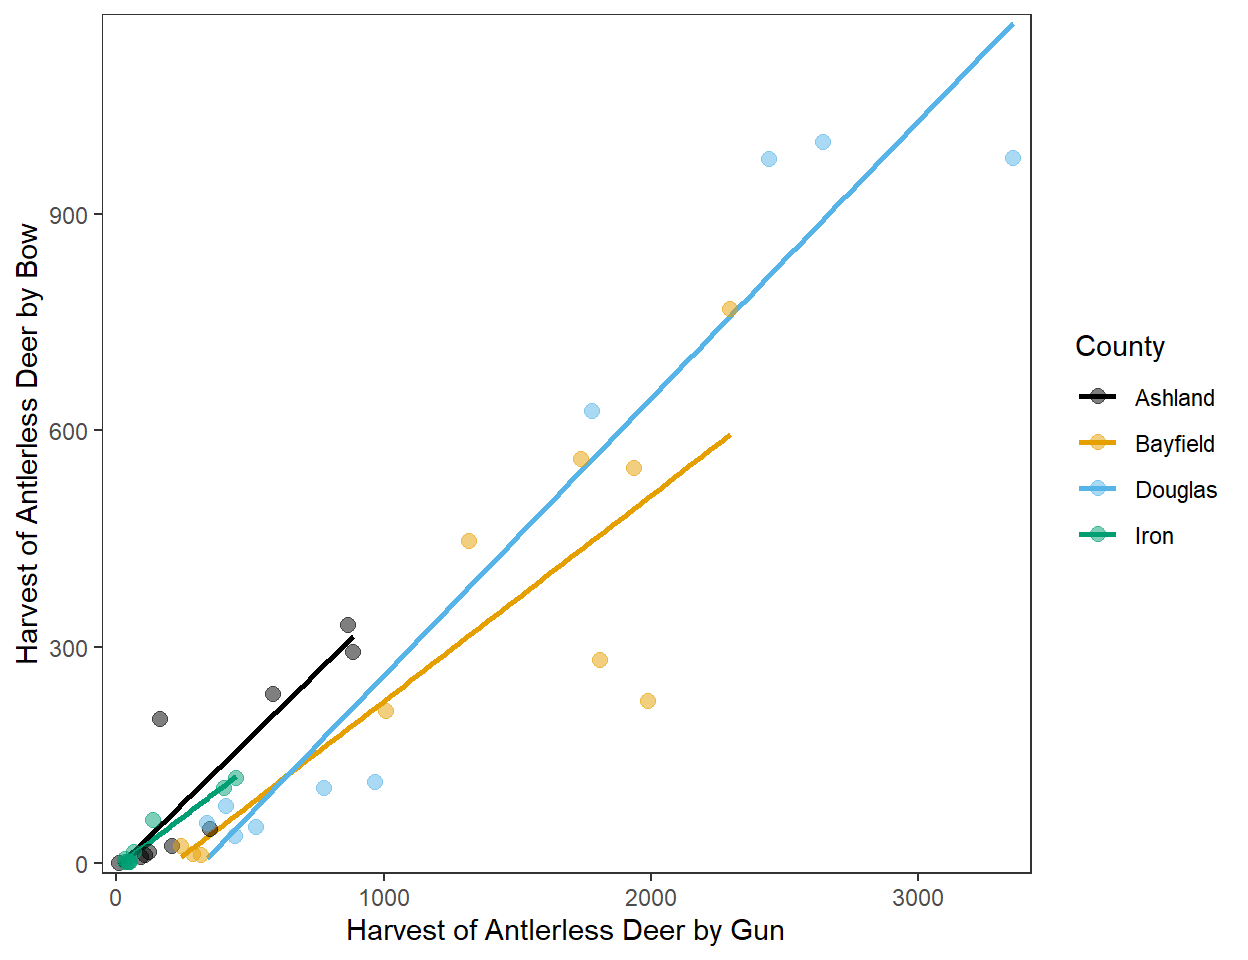
Does it “feel” like the relationship (i.e., the slope) between antlerless deer harvested by bow and gun differs among the counties? Explain!
Total Annual Harvest by Year and County
Construct ggplot2 code to match the graph below (as closely as you can).
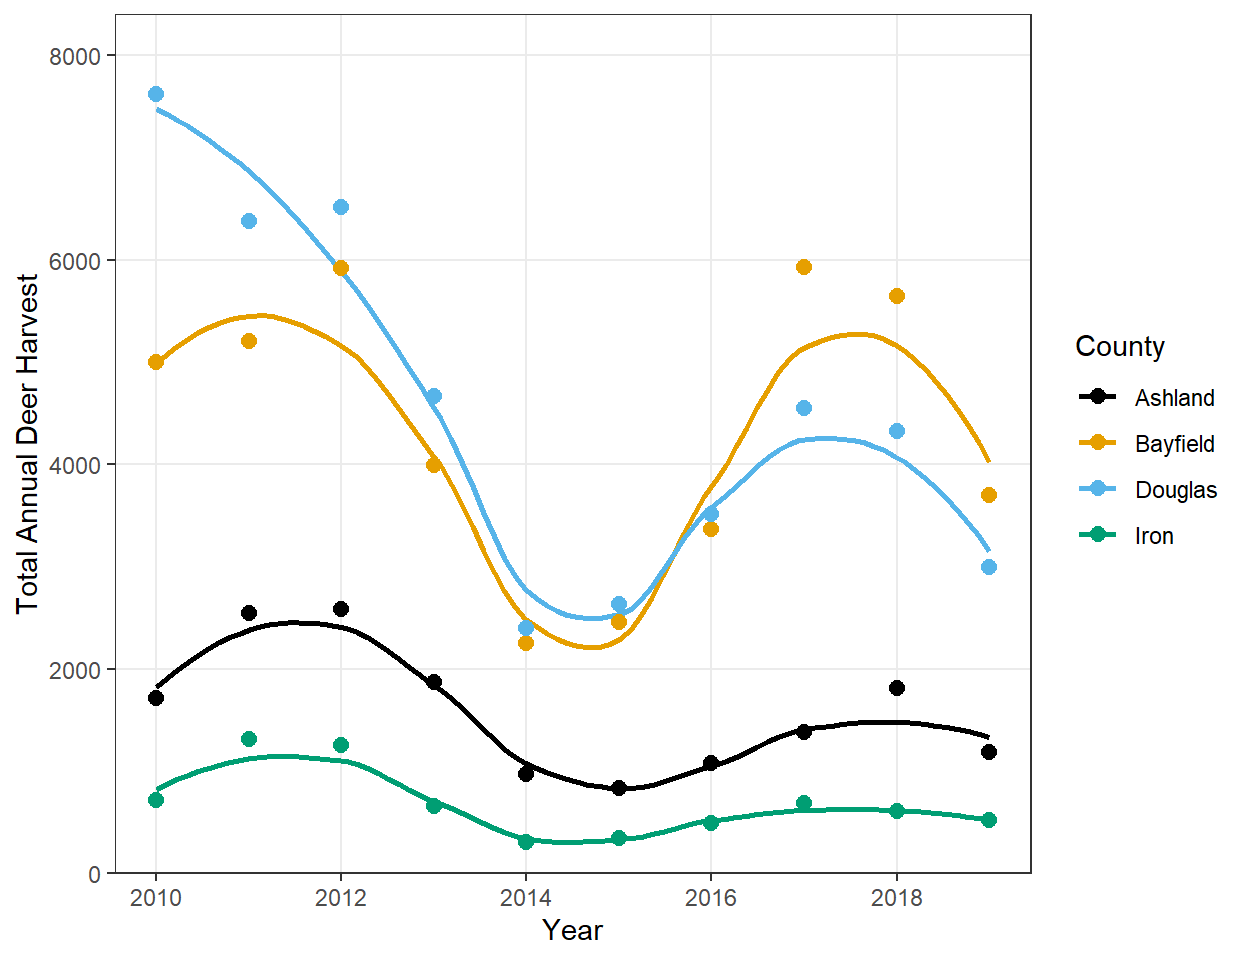
Make two observations from this graph.
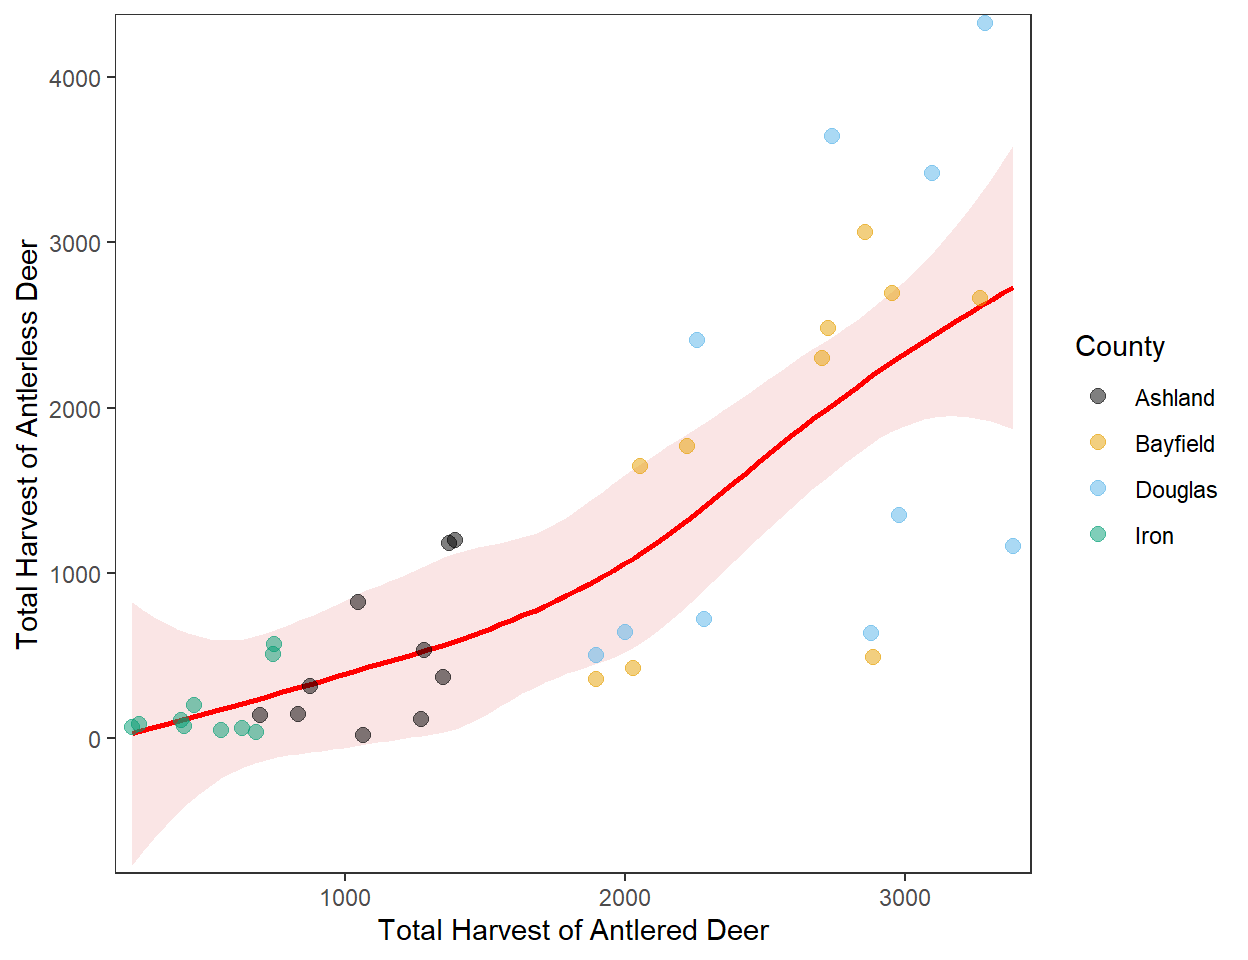
Total Harvest of Antlered vs Antlerless
Construct ggplot2 code to match the graph below (as closely as you can).