Background
This is the same data set introduced here (which included code for accessing the data). If you did those exercises, then you can use the same data and package (e.g., tidyverse) loading portion of your script. If you did not do those exercises then please see that page for the instructions on loading the data.
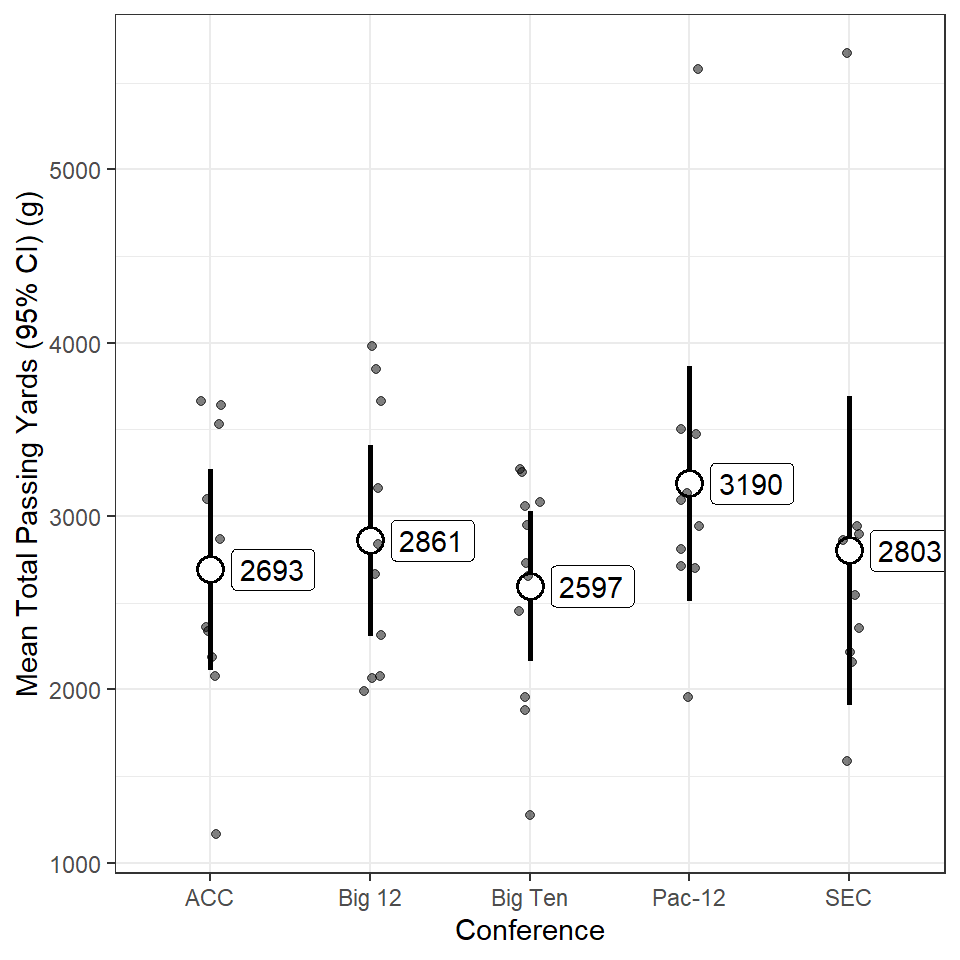
Total Passing Yards by Conference 1
Construct ggplot2 code to match the graph below (as closely as you can).
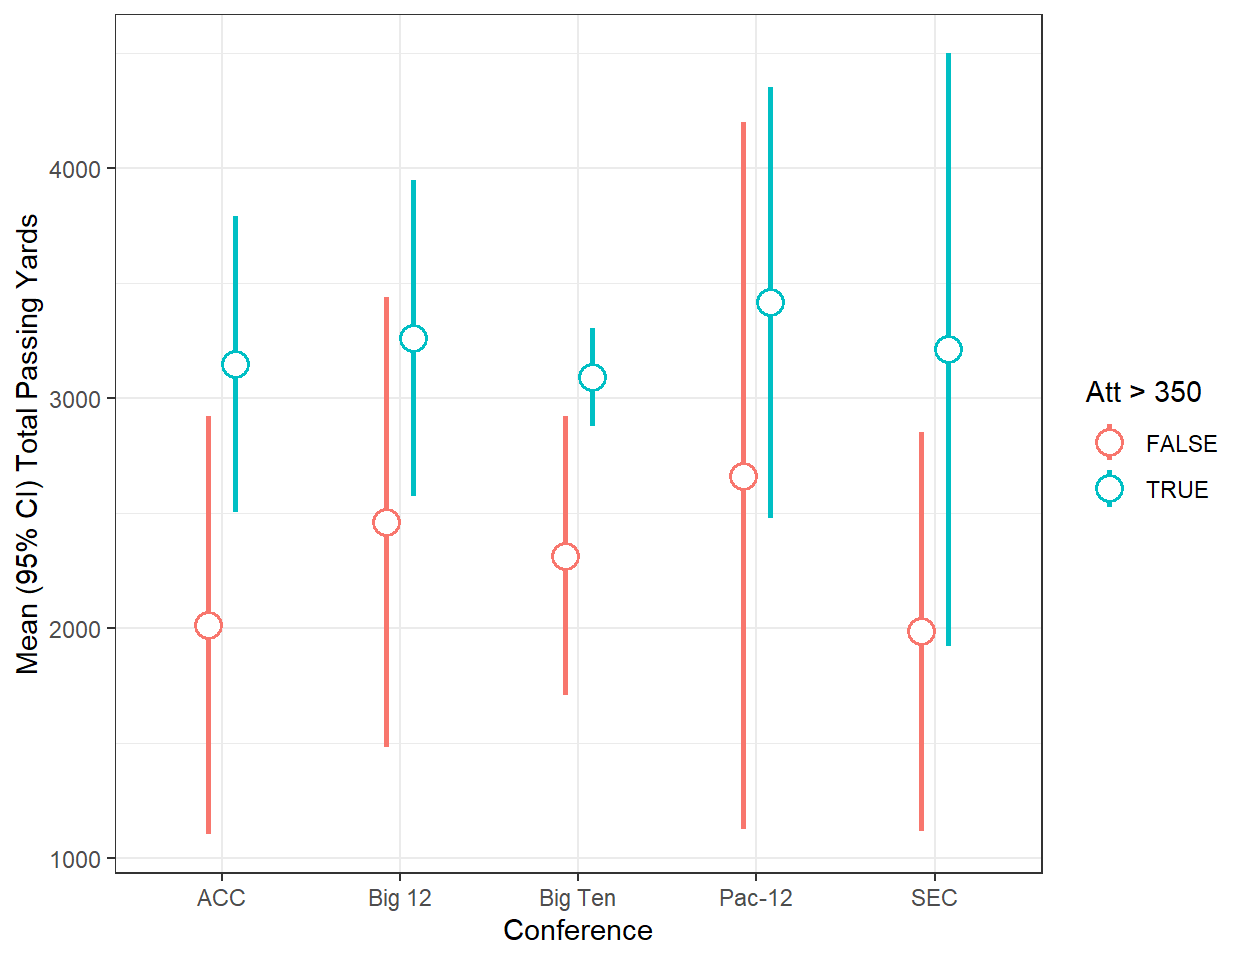
Total Passing Yards by Conference and Attempts
Construct ggplot2 code to match the graph below (as closely as you can).
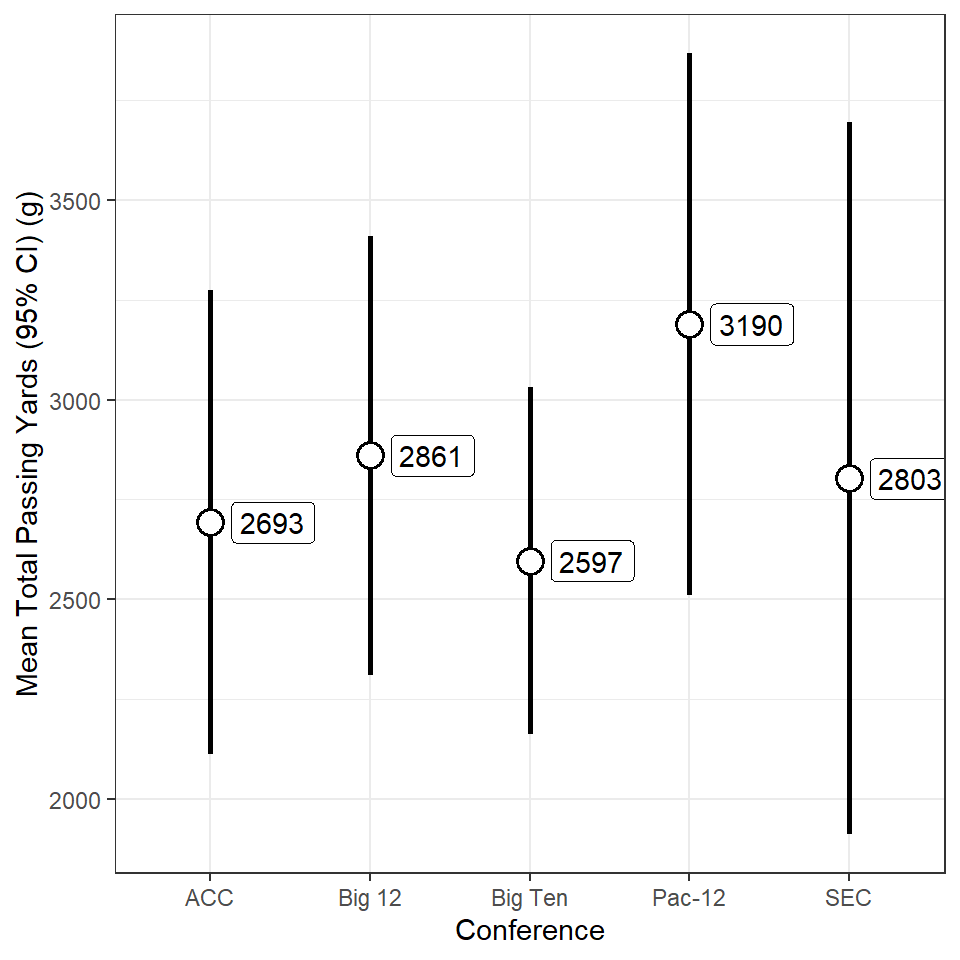
Total Passing Yards by Conference 2
Construct ggplot2 code to match the graph below (as closely as you can). [HINT: Copy your code from above and then modify.]
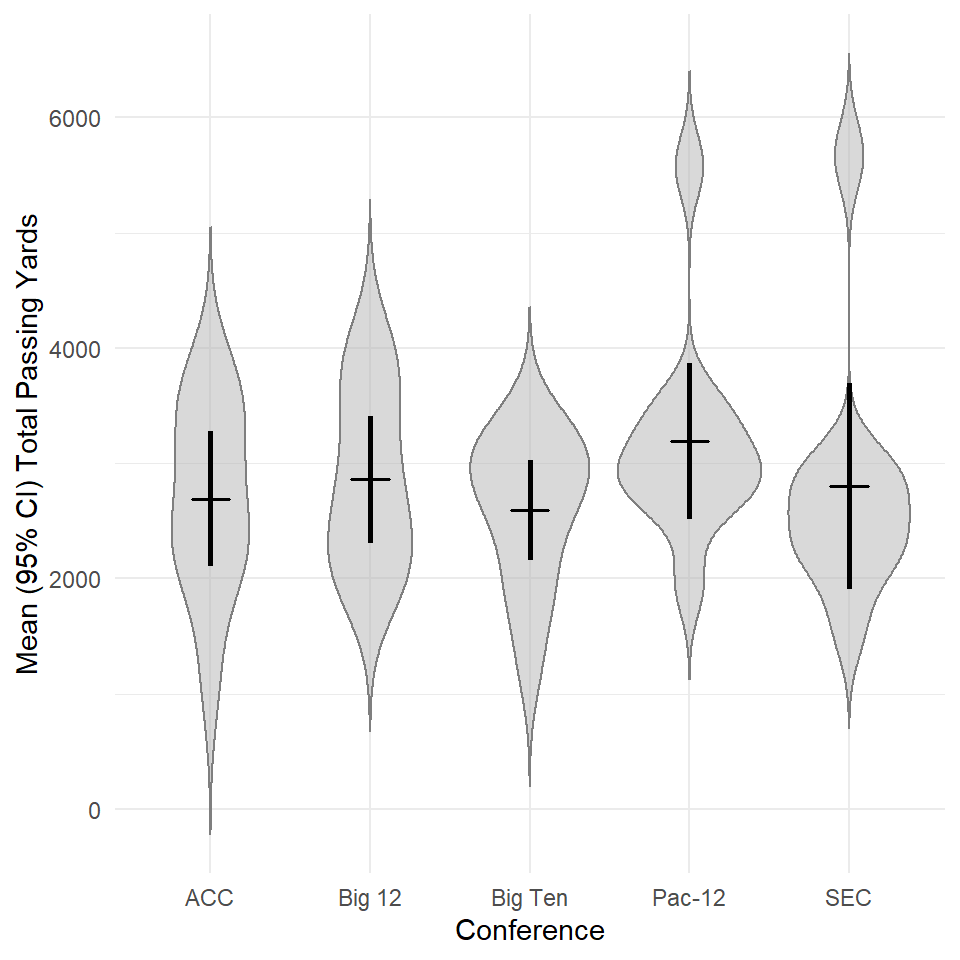
BONUS - Total Passing Yards by Conference 3
Construct ggplot2 code to match the graph below (as closely as you can). Hint: If you saved your plot from the previous section, you should be able to create this plot by “adding” one function of code to the saved ggplot object.